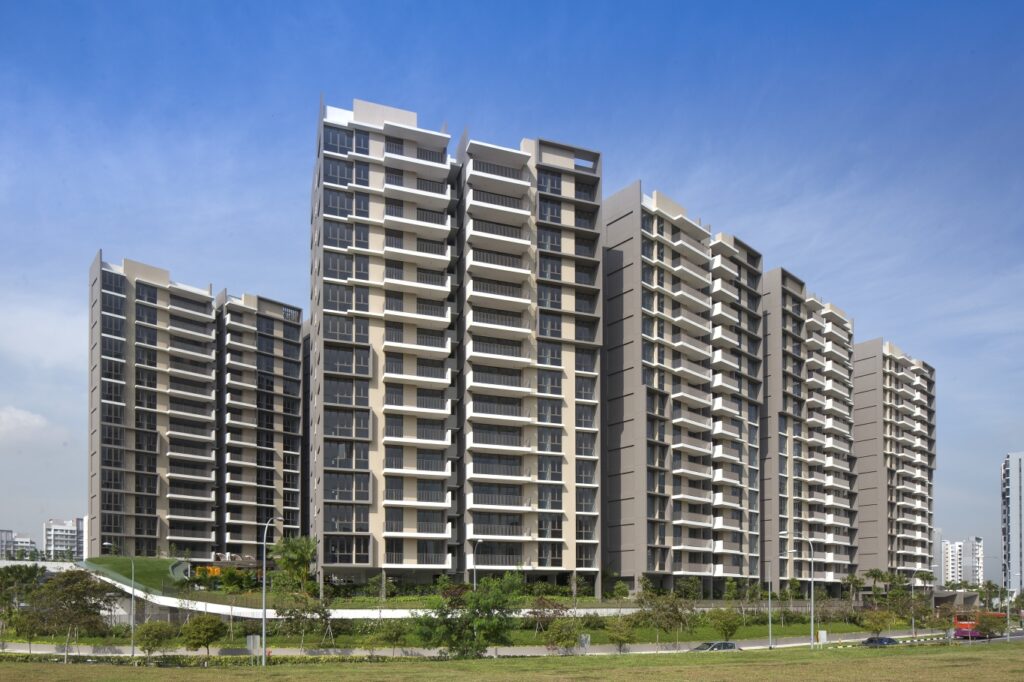
Most Executive Condominiums quietly fade into the background once their five-year minimum occupation period lapses. Treasure Crest did the opposite. Since its resale market opened, this 504-unit development on Anchorvale Crescent has cleared 190 recorded transactions, watched its median transacted PSF climb from $1,076 in late 2021 to $1,635 by the final quarter of 2026, and quietly established itself as the 10th highest-ranked project out of the 317 that Hiva tracks in District 19.
That last statistic is the one worth pausing on. An EC — the most policy-constrained, subsidy-linked housing product in Singapore's private market — is sitting in the top handful of projects in a district that includes waterfront condominiums, freehold boutique blocks and newer launch stock. Nationally, Treasure Crest ranks 12th, placing it in the top one per cent of all projects in Hiva's database.
So what exactly is going on here? Is this a genuine outperformer, or a well-located mass-market project riding a district-wide tide? This deep dive breaks down the transaction record quarter by quarter, examines the accessibility and school catchments that underpin demand, walks through the lease and policy timeline that will shape the next decade, and asks the uncomfortable questions a buyer should be asking before writing a cheque.
Project Overview: The Anatomy of a Sengkang EC
Treasure Crest occupies a site of roughly 187,831 square feet along Anchorvale Crescent, in the planning area of Sengkang within District 19. It was developed by Sim Lian (Anchorvale) Pte Ltd, the EC and mass-market arm of Sim Lian Group — a developer with a long track record in high-volume, efficiently planned residential projects in the outer regions.
| Attribute | Detail |
|---|---|
| Project name | Treasure Crest |
| Address | Anchorvale Crescent |
| District | 19 (Sengkang / Punggol / Hougang) |
| Market segment | Outside Central Region (OCR) |
| Property type | Executive Condominium |
| Developer | Sim Lian (Anchorvale) Pte Ltd |
| Tenure | 99-year leasehold, commencing 2015 |
| Total units | 504 |
| Year of TOP | 2018 |
| Unit mix | 2- to 5-bedroom apartments |
| Google rating | 4.4 / 5 from 109 reviews |
The unit mix — spanning two- to five-bedroom configurations — is a meaningful detail. It means Treasure Crest is not a monoculture of shoebox investor units. It houses young couples in two-bedders, families in three- and four-bedders, and multi-generational households in the five-bedroom stacks. The development was completed with higher-than-typical ceiling heights and generous glazing, features that were marketed heavily at launch and that continue to show up in resale listings as differentiators.
The timeline that matters
Unlike a private condominium, an EC's value is shaped as much by policy dates as by market cycles. Treasure Crest's timeline is unusually clean, and it explains almost everything in the transaction data.
The 2023 date is the fulcrum. Before it, the project was effectively a closed shop — owners could not sell to the open market. After it, 504 units became available to a much larger pool of buyers at once. The transaction record shows exactly that hinge, and we will get to it shortly.
Transaction Analysis: From Trickle to Torrent to Squeeze
Hiva's transaction window for Treasure Crest begins in the fourth quarter of 2021, which means the original 2015–2018 developer sales fall outside the dataset. Everything captured here is secondary-market activity. Across the full window, the project has logged 190 transactions.
The first thing that jumps out is how lopsided the volume distribution is. Between late 2021 and mid-2022, only four transactions were recorded — one in 2021Q4, one in 2022Q1 and two in 2022Q3. Then the record goes completely silent for four consecutive quarters before erupting in the third quarter of 2023.
Quarterly transaction volume
TREASURE CREST — Quarterly Transaction Volume
The shape of that chart tells a story in four acts:
- Act 1 — the trickle (2021Q4 to 2022Q3): Four transactions in a year. This is the pre-MOP period, when the project was largely locked up and the handful of recorded deals reflect limited, atypical circumstances rather than a functioning resale market.
- Act 2 — the unlock (2023Q3 to 2023Q4): 15 transactions in one quarter, then 41 in the next. That is 56 transactions in six months on a 504-unit estate — more than 11% of the entire development changing hands in half a year. This is the MOP release valve opening, and the price action that accompanied it was dramatic.
- Act 3 — peak liquidity (2024): 81 transactions across the year, a turnover rate of roughly 16% of total units. For context, a typical mass-market condominium turns over somewhere in the mid-single digits annually. Treasure Crest in 2024 was a genuinely liquid market where buyers had real choice and sellers had real competition.
- Act 4 — the squeeze (2025 into 2026): Volume collapses to 34 transactions in 2025 and 15 in 2026. This is not demand evaporating — it is supply drying up. The pent-up MOP cohort has largely been absorbed, and remaining owners are holding.
That final act is the single most important dynamic for anyone buying today. The project has shifted from a buyer's market with abundant stock to a thinner market where well-priced units move quickly and negotiating leverage has narrowed.
The price trajectory
The PSF series is remarkably clean. From 2023Q3 onward, Treasure Crest's average transacted PSF posted eight consecutive quarterly increases — from $1,378 to $1,579 — before a pair of shallow, roughly one-per-cent dips in 2025Q4 and 2026Q2 that look like noise rather than inflection.
TREASURE CREST — Quarterly Average PSF
A caveat worth stating plainly: the 2021–2022 data points rest on a sample of one to two transactions per quarter and almost certainly reflect an unusual unit mix rather than a true market clearing price. The reliable baseline is 2023Q3 at $1,378 psf, the first quarter with a meaningful sample. From that baseline to $1,635 psf in 2026Q4, the project has appreciated 18.7% in PSF terms over roughly three and a quarter years — an annualised pace in the mid-single digits, which for a leasehold OCR executive condominium is a solid, sustainable trajectory rather than a speculative spike.
Annual averages
Aggregating the quarters into calendar years gives a cleaner view of momentum.
| Year | Transactions | Avg Transacted Price | Avg PSF | PSF Change |
|---|---|---|---|---|
| 2021 | 1 | $1,238,880 | $1,076 | — |
| 2022 | 3 | $1,191,667 | $1,119 | +4.0% |
| 2023 | 56 | $1,505,959 | $1,393 | +24.5% |
| 2024 | 81 | $1,583,120 | $1,434 | +2.9% |
| 2025 | 34 | $1,719,615 | $1,541 | +7.5% |
| 2026 | 15 | $1,763,667 | $1,600 | +3.8% |
The 2023 jump is the MOP re-rating — owners who had held through construction finally testing the open market, and buyers paying for a five-year-old EC with a fresh lease rather than a 20-year-old resale flat. Note that 2024, despite being the peak volume year, delivered the smallest PSF gain (+2.9%) — the classic signature of a supply release, where a flood of competing units caps pricing power. Then, as volume collapsed in 2025, PSF growth reaccelerated to +7.5%. Scarcity, not sentiment, is now the dominant price driver.
TREASURE CREST — Annual Average Transacted Price
The absolute price line is equally telling. The average transacted quantum crossed $1.5 million in 2023, $1.7 million in 2025 and now sits at roughly $1.76 million. Part of that is unit-mix drift — larger units transacting in later years — but a meaningful part is pure price appreciation.
Reading the micro-transactions
Zooming into the most recent December closings (all recorded as resales) illustrates how floor level and unit size drive pricing within the same development.
| Month | Floor Range | Area (sqm) | Price | PSF |
|---|---|---|---|---|
| Dec 2025 | 01–05 | 100 | $1,640,000 | $1,524 |
| Dec 2025 | 06–10 | 100 | $1,668,000 | $1,550 |
| Dec 2025 | 01–05 | 107 | $1,700,000 | $1,476 |
| Dec 2024 | 11–15 | 100 | $1,580,000 | $1,468 |
| Dec 2024 | 01–05 | 125 | $2,040,000 | $1,516 |
| Dec 2024 | 11–15 | 89 | $1,460,000 | $1,524 |
| Dec 2023 | 06–10 | 100 | $1,530,000 | $1,421 |
| Dec 2023 | 01–05 | 100 | $1,380,000 | $1,282 |
| Dec 2023 | 11–15 | 100 | $1,488,000 | $1,382 |
| Dec 2023 | 06–10 | 107 | $1,645,000 | $1,428 |
Three observations:
- The floor premium is real but modest. In December 2025, two 100 sqm units transacted a fortnight apart in spirit — one on levels 01–05 at $1,640,000, one on levels 06–10 at $1,668,000. That is a 1.7% uplift for five storeys. Compare that to December 2023, when the spread between a low-floor and a high-floor unit of identical size was closer to 7–8%. As the market has tightened, the floor premium has compressed — buyers are paying for the address, not the view.
- Bigger units command a lower PSF. The 125 sqm unit at $1,516 psf and the 107 sqm unit at $1,476 psf both sit below comparable 100 sqm transactions. This is the standard quantum effect: larger units carry a PSF discount because the absolute price tag is the binding constraint.
- Compact units hold PSF best. The 89 sqm unit transacted at $1,524 psf in December 2024 — the highest PSF in that month's sample, despite being the smallest. If you are buying for rental or resale efficiency, the smaller three-bedders are the PSF leaders.
How Treasure Crest sits within District 19
Hiva tracks 317 projects in District 19, with a district-wide average PSF of $1,522. Treasure Crest's 2026 average of about $1,600 psf — and its 2026Q4 print of $1,635 — places it roughly 5–7% above the district average.
That is a meaningful positioning statement. This is not a distressed asset trading at a discount to its neighbourhood. It is trading at a premium to the district mean while carrying a 99-year leasehold tenure that began only in 2015. Put differently: the market is pricing Treasure Crest as one of the better addresses in Sengkang, not merely as an affordable EC.
Rental Performance: What the Data Does and Doesn't Show
This is where honesty matters more than narrative. Hiva's dataset for Treasure Crest contains no recorded rental transactions. There is no rental PSF median, no rental volume series, and consequently no defensible way to compute a gross rental yield from the data in front of us.
That absence is itself informative, and worth unpacking rather than glossing over.
First, why the rental record is thin. Executive Condominiums are, by design, owner-occupier products for their first five years. Even after MOP, EC owners tend to rent out less frequently than comparable private condominium owners — the buyer profile skews toward families who purchased to live in, not to lease out. A 504-unit development with a family-oriented 2-to-5-bedroom mix will naturally generate a smaller rental pool than, say, a 300-unit condominium next to an MRT interchange. This is good news for residents (a more stable, owner-occupied community) and mildly inconvenient for investors seeking comparable evidence.
Second, what the structural rental drivers look like. Treasure Crest sits within 800 metres of Sengkang MRT and LRT interchange, and within 300 metres of Cheng Lim LRT. Sengkang and neighbouring Punggol have developed into genuine employment catchments in their own right — the Seletar Aerospace Park cluster, the Punggol Digital District, and the broader north-east industrial and logistics belt all generate tenancy demand. The tenant profile for a family-sized three-bedroom in this location is typically a dual-income household priced out of the condominium belt further south.
Third, what an investor should actually do about it. Without project-level rental contracts, the correct approach is to triangulate from two directions: the rental PSF achieved by comparable leasehold condominiums in the Sengkang/Punggol corridor, and the rental PSF achieved by other post-MOP ECs in the same planning area. Compare those against your entry price per square foot — and be conservative. Remember that a $1,640,000 purchase on a 1,076 sqft unit implies a gross yield that must clear your financing cost, maintenance, property tax and vacancy allowance before it means anything.
The pragmatic conclusion: treat Treasure Crest as a family home first and a yield instrument second. The transaction data supports a capital-appreciation thesis convincingly. It does not support a rental-yield thesis, because the evidence simply isn't in the dataset.
Neighbourhood & Lifestyle: The Anchorvale Advantage
Sengkang is often discussed in the aggregate, as if the whole town traded on the same fundamentals. It doesn't. Anchorvale is a distinct pocket, and Treasure Crest sits in one of its better-connected corners. The nearby-amenity profile is genuinely strong across every category that matters to a young family.
Getting around
| Transport Node | Distance |
|---|---|
| Cheng Lim LRT | 0.3 km |
| Farmway LRT | 0.5 km |
| Sengkang MRT / LRT Interchange (North East Line) | 0.8 km |
Two LRT stops within 500 metres is a genuinely useful configuration — it means the morning commute isn't hostage to a single feeder service. Cheng Lim at 300 metres is roughly a four-minute walk; Farmway at 500 metres adds an alternative route. And Sengkang at 800 metres puts the North East Line directly within reach, giving a direct, no-transfer ride to Serangoon, Dhoby Ghaut and HarbourFront.
For drivers, the Anchorvale corridor connects readily to the Tampines Expressway and the Kallang–Paya Lebar Expressway network, putting the CBD roughly 20–25 minutes away outside peak hours and Changi Airport within a similar band.
Schools: the quiet superpower
This is where Treasure Crest earns a disproportionate share of its appeal.
| Primary School | Distance |
|---|---|
| Springdale Primary School | 0.5 km |
| Compassvale Primary School | 0.7 km |
| Punggol Green Primary School | 0.7 km |
| Nan Chiau Primary School | 0.7 km |
| Anchor Green Primary School | 1.1 km |
Four primary schools within 700 metres is an exceptional density, and it matters enormously under the Primary 1 registration framework, where home-to-school distance bands determine ballot priority. Nan Chiau Primary in particular carries strong brand equity as a Special Assistance Plan school, and being within the 1-kilometre priority radius is a material advantage that translates directly into resale demand.
For secondary education, the Sengkang corridor hosts a spread of institutions, with the wider north-east also served by well-regarded schools in Hougang and Punggol. The practical effect for a family with young children: you can plausibly execute an entire primary school journey without a single school bus contract.
Daily necessities and lifestyle
| Amenity | Distance |
|---|---|
| Sheng Siong (Anchorvale) | 0.4 km |
| U Stars Supermarket | 0.5 km |
| Prime Supermarket | 0.5 km |
| Cold Storage | 0.7 km |
| Compass One | 0.7 km |
| Waterway Point | 1.4 km |
| Rivervale Mall | 1.5 km |
| Rivervale Plaza | 1.8 km |
Five supermarkets within 700 metres is the kind of statistic that sounds trivial until you've lived somewhere with one. Sheng Siong at 400 metres is the everyday workhorse — fresh produce, wet-market-style pricing, open late. Cold Storage at Compass One covers the premium grocery run. U Stars and Prime provide the value tier.
Compass One at 700 metres is the anchor mall: a full-line suburban retail centre stacked directly above Sengkang MRT with a cinema, F&B and a department store. Waterway Point at 1.4 km — the waterfront mall at Punggol — is a short LRT hop or a pleasant cycle away, and adds a second full-scale retail destination. Between the two, residents have effectively two town-centre-grade malls within a kilometre and a half, which is a level of retail redundancy most suburban addresses can't match.
For hawker food, the Anchorvale and Sengkang neighbourhood centres deliver the usual strong Singaporean hawker and coffee-shop mix — the kind of everyday affordability that makes a real difference to monthly household cashflow.
Green space
| Park | Distance |
|---|---|
| Sengkang Riverside Park | 1.0 km |
| St. Anne's Wood Playground | 1.4 km |
| Punggol Waterway Park | 1.9 km |
Sengkang Riverside Park at one kilometre is the standout — a 20-hectare riverine park along the Punggol–Serangoon waterway with cycling paths, water-play areas and connections into the wider park connector network. Punggol Waterway Park at 1.9 km extends the same green corridor eastward. The result is a continuous recreational loop for runners, cyclists and young families, ending in one of Singapore's most scenic public spaces.
What a weekday actually looks like
A composite picture: a couple in their early thirties, one working in the CBD, one in the north-east. The CBD commuter walks four minutes to Cheng Lim, rides one LRT stop to Sengkang, transfers to the North East Line and is at Raffles Place in roughly 40 minutes door-to-door. The other drives 10 minutes to Seletar or takes a bus into Punggol Digital District. The helper or a grandparent picks up the child from Springdale Primary, 600 metres from the lobby. Dinner is Sheng Siong groceries, or a hawker run — or, on a Friday, Compass One.
That is a genuinely functional suburban life, executed with more amenity density than most OCR addresses can claim.
Community Pulse: What the 4.4 Rating Tells Us
Treasure Crest carries a Google rating of 4.4 out of 5, drawn from 109 reviews. That is a solid, credible number. It is not the sycophantic 4.8 that comes from a handful of enthusiastic early reviewers, nor the 3.6 that signals chronic maintenance problems. A 4.4 on a base of 109 reviews suggests a resident body that is broadly satisfied but willing to register specific grievances.
Hiva's dataset captures the aggregate rating and review count for this project, but not the individual review text — so rather than fabricate quotations, it's more useful to explain what a 4.4 with this sample size practically implies, and what a buyer should verify first-hand.
What 109 reviews signals. Review volume is a proxy for how many residents were motivated enough to write one. On a 504-unit estate, 109 reviews means a reasonably engaged community — not a development where residents feel invisible, but also not one where everybody is evangelising. The distribution almost certainly skews to two groups: long-term owner-occupiers with a strong sense of attachment, and a minority with a specific repair, management or neighbourly complaint. That's normal for a completed EC approaching its decade mark.
The positives residents of ECs like this typically emphasise — and which the data supports structurally — cluster around layout efficiency (Sim Lian's floor plans are generally well-regarded for usable room sizes and limited wasted corridor space), the amenity deck and pool cluster, the school proximity, and the generally low-density feel that comes from a 504-unit site of nearly 188,000 square feet.
The friction points worth interrogating typically relate to things a brochure can't tell you: carpark allocation and visitor parking behaviour, the condition of lift lobbies on the older blocks, the pace of common-area maintenance as the project passes its sixth or seventh year, the noise profile of units facing Anchorvale Crescent versus those facing inward, and whether the management corporation is building a meaningful sinking fund.
Practical advice: before committing, visit at two different times — a weekday evening around 7.30pm, and a Sunday morning around 9am. The first shows you how the car park, lifts and pool deck behave under peak load. The second shows you how the community actually lives. Read the most recent 20 Google reviews rather than the top-rated ones; they will surface whatever the current pain point is.
Future Outlook: What Drives Treasure Crest From Here
Four structural forces will determine the project's performance over the next five to ten years. Three are tailwinds. One is a permanent, slow headwind.
1. Lease decay — manageable, not yet material
The 99-year lease commenced in 2015, which means Treasure Crest carries approximately 88 years of remaining lease as at 2026. This is comfortably inside the zone where financing and CPF usage remain straightforward, and it places the project comfortably ahead of the structural depreciation curve that starts to bite below 60 years remaining.
For a buyer today, the practical implication is that lease decay will not be a financing constraint for the entirety of a normal holding period. But it does mean the project's long-run price path is a decay-adjusted one: capital appreciation must outrun roughly one year of lease burn per calendar year. That is easy in a rising market and unforgiving in a flat one.
2. Privatisation in 2028 — the sleeper catalyst
Ten years after TOP, an Executive Condominium is fully privatised: the buyer pool widens beyond Singapore Citizens and Permanent Residents, and foreign purchasers become eligible. For Treasure Crest, TOP was in 2018, which points to 2028 as the year that gate opens.
This is genuinely under-appreciated. It does not guarantee a price jump — foreign buyer demand in an OCR location is not what it is in Districts 9, 10 or 15 — but it does mean the address moves from a policy-constrained product to an ordinary leasehold condominium for transaction purposes. In a market where foreign buyers face steep additional stamp duties, the effect is likely to be marginal rather than dramatic. Treat it as a small, structural improvement in liquidity, not a catalyst to trade around.
3. Supply and the thinning pipeline
The volume chart earlier told the clearest forward-looking story: 34 transactions in 2025 and 15 in 2026 against 81 in 2024. The MOP cohort that flooded the market in 2023–2024 has been absorbed. Owners who remain are, by definition, those who chose not to sell through a period of rising prices — a group with less urgency and stronger holding power.
The consequence for buyers is straightforward: choice is shrinking and negotiation leverage is narrowing. Well-priced, well-oriented units are now moving against limited competing stock. If you find a unit that suits you at a fair PSF, the evidence suggests waiting for a better one is a higher-risk strategy than it was two years ago.
The wider district pipeline matters too. Sengkang and Punggol have been among Singapore's most active corridors for new housing supply, and every new launch resets the buyer's alternative. Treasure Crest's defence is completion: it is built, the lease is fresh, the schools are within walking distance, and it trades at a discount to new-launch pricing per square foot once you account for the smaller new-build formats.
4. Rail and regional connectivity
The existing rail offer — two LRT stops within 500 metres and the North East Line at 800 metres — is the project's structural backbone and is not going to change. The wider north-east network continues to densify, with the Cross Island Line's Punggol extension targeted for the early 2030s. It won't add a station within walking distance of Anchorvale Crescent, but it will relieve pressure on the north-east corridor as a whole and strengthen the region's employment gravity — which is ultimately what supports rental and resale demand.
A phase-by-phase view
The pattern is textbook and worth internalising: liquidity peaked, prices lagged, then scarcity took over. Buyers who moved in 2024 bought choice at the cost of a modestly higher entry point than 2023. Buyers in 2026 face less choice at a materially higher price. Neither is obviously wrong — but they are different bets.
Overall Assessment: A Strong Performer, Not a Bargain
Let's be direct about what Treasure Crest is and isn't.
It is a strong performer in District 19. Ranking 10th out of 317 tracked projects in the district and 12th nationally is not an accident of location alone. It reflects a genuine combination of transport accessibility, exceptional school density, retail redundancy and a lease that still has roughly 88 years left. The PSF trajectory — a mid-single-digit annualised pace sustained across multiple years with only two trivial quarterly dips — describes a market that reprices steadily rather than violently. That is the profile of a well-loved family home, not a speculative vehicle.
It is not cheap relative to its district. At roughly $1,600 psf in 2026 against a District 19 average of $1,522, and with individual transactions printing above $1,600 psf in the final quarter, Treasure Crest trades at a premium to the district mean. The value case is therefore not "buy the discount." The value case is "buy the execution": you are paying for a completed, well-located, school-adjacent development with a young lease, and accepting that the market has already recognised most of those virtues.
The most defensible buyer profile is a family with school-age or preschool children who intends to hold for at least seven to ten years. In that scenario, the school catchment, the amenity density and the lease runway all work for you, and the entry price's modest premium to the district average is amortised over a long holding period.
The weakest buyer profile is a short-horizon investor seeking yield. The rental record is thin, the volume pipeline has narrowed, and the 2028 privatisation is unlikely to be a step-change event for an OCR address. This is not a cash-flow play.
Verdict: a top-tier Sengkang EC with a genuine lifestyle case and a solid, market-rate capital appreciation record — best suited to owner-occupiers, defensible for long-hold investors, and unsuited to anyone hoping to buy below the neighbourhood's going rate.
Food for Thought
Five questions worth sitting with before you commit.
1. Are you paying for the school or the address? Four primary schools within 700 metres is Treasure Crest's single strongest differentiator — and it is fully priced in. If your children are already past Primary 6, ask yourself honestly whether you'd pay the same premium for the transport and mall access alone. If the answer is no, you may be overpaying for a benefit you won't use.
2. What does the price per square foot look like against new-launch alternatives? Treasure Crest trades above the District 19 average, but new launches typically price higher still — in exchange for a newer lease, a smaller and often less efficient layout, and a wait of several years. Run the comparison on a like-for-like quantum basis, not just headline PSF. The EC's larger, older-format layouts are a genuine, quantifiable advantage that doesn't show up in a per-square-foot table.
3. Can you live with the lease clock? At roughly 88 years remaining, the decay is invisible today. In fifteen years, at roughly 73 years remaining, it starts to appear in valuation conversations. If your intended holding period is under a decade, this is a non-issue. If you're buying what you think is a forever home, model the exit at year fifteen and see whether the numbers still work.
4. Is the volume squeeze an opportunity or a warning? Falling transaction volume can mean either "owners are confident" or "the market has run out of buyers." Here the concurrent PSF growth strongly favours the first reading. But verify it yourself: track the days-on-market for the specific stack you want. If units in your preferred layout are sitting for months while others move, the aggregate numbers are hiding a segment-level problem.
5. What will the 2028 privatisation actually change? Spend thirty minutes modelling the foreign-buyer case honestly. Additional buyer's stamp duty for foreigners is steep, OCR locations rarely top their wish lists, and the incremental demand may be modest. If a significant part of your investment thesis rests on privatisation, you may be over-engineering a minor narrative into a major one.