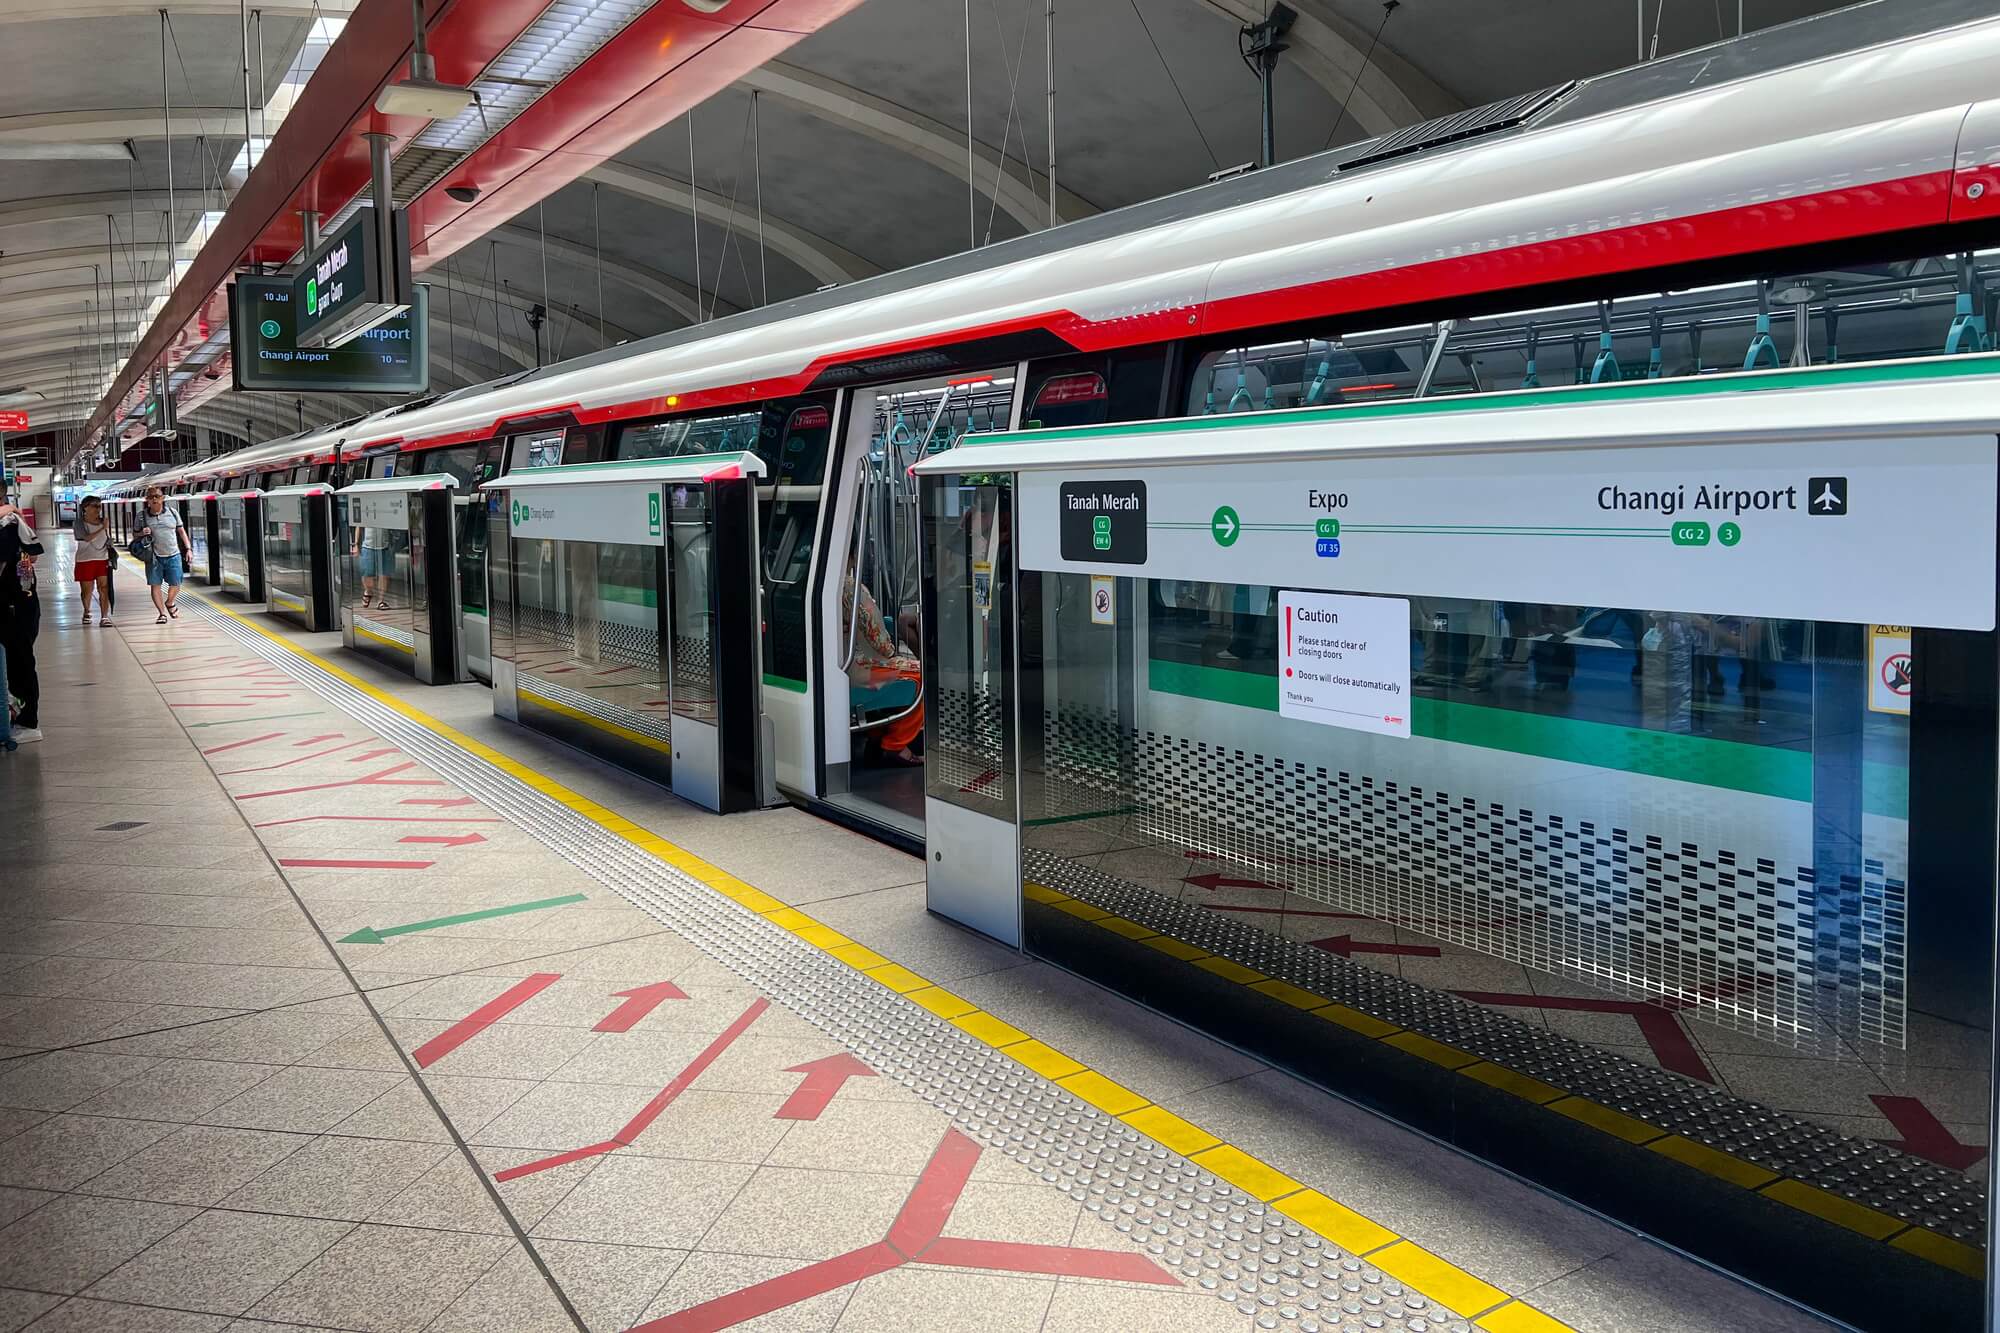
Two four-room flats. Same floor area, same lease start year, same number of rooms, both within a ten-minute walk of an MRT station. One sits in Bishan, the other in Sengkang. The price gap between them is routinely six figures — often S$200,000 or more.
Nothing in the brochures explains that gap. The floor plans are identical. The finishes are comparable. What differs is something no floor plan shows: how long it takes to get to work.
Commute time is the most under-priced variable in Singapore residential property. It is not hidden, exactly — the MRT map is public, the bus routes are published, the travel-time data sits on LTA's open data platforms. But buyers rarely convert it into dollars. They compare per-square-foot prices, they compare lease decay, they compare renovation costs — and then they make a decision that will lock in hundreds of hours a year of their life without ever putting a number on it.
This piece does that conversion. It looks at how commute times to Singapore's key employment hubs show up in resale flat and condo prices across districts, where the relationship holds, where it breaks down, and how a buyer can actually weigh commute savings against housing costs without getting lost in the noise.
The 45-Minute City: How Singapore Planned Commute Time Into Property Values
A planning doctrine, not an accident
Singapore's land-use planning has been explicit about travel time for years. URA's long-term planning framework is built around the idea of a "45-minute city and 20-minute towns" — the target being that most residents should be able to complete a peak-hour journey to work within roughly 45 minutes door to door, and that everyday amenities should sit within about 20 minutes of home.
That is a land-transport policy. It is also, unavoidably, a property pricing policy.
When the state decides where to put a rail line, it is deciding which parcels of land will be 25 minutes from Raffles Place and which will be 55. Over a decade or two, that decision migrates into resale prices. The mechanism isn't mysterious: households bid for accessibility, and the supply of accessible homes is fixed in the short run.
The rail network has expanded steadily to deliver this. Singapore's MRT system now spans more than 140 stations across six lines, supplemented by the LRT feeder networks in Bukit Panjang, Sengkang and Punggol. According to LTA's published timelines, the network continues to grow through the late 2020s and into the 2030s.
Each of those dates is a repricing event. Not always a dramatic one, and rarely an immediate one — but a repricing event nonetheless.
Why commute time is a capitalised cost
Here is the core idea in one sentence: a commute is a recurring cost, and recurring costs get capitalised into asset prices.
If two otherwise identical flats differ by 20 minutes of daily travel each way, the cheaper one isn't actually cheaper — it just shifts part of the payment from the mortgage to your calendar. Over a 25-year horizon, the difference compounds into thousands of hours. Those hours have a price, whether or not you ever write it down.
The question buyers should be asking is not "which is cheaper?" but "what is the market charging me for the extra 20 minutes, and is that a fair price?"
How Commute Time Is Priced Into Singapore Homes
The rent-theory version, translated
Classic urban economics says land values peak where access is best and decline with distance — the "bid-rent" curve. Singapore compresses this into a very small island with very fast transport, so the curve is steep and lumpy. A few kilometres can move you from a S$900,000 resale flat to a S$650,000 one.
But the curve isn't smooth, because Singapore's accessibility is delivered in discrete packages: a station, a line, an interchange, an expressway exit. Buyers don't pay for distance — they pay for time, and time changes in steps, not gradients.
What buyers are actually paying for
When a buyer pays the central premium, they are bundling several things together. Commute time is only one of them — but it's the one that gets least scrutiny.
| Component of the "central premium" | What it actually is | How it's priced |
|---|---|---|
| Commute time | Minutes saved per trip, capitalised | Partly visible in price; rarely explicit |
| Amenity density | Hawkers, malls, clinics, groceries | Priced efficiently — buyers see it |
| School access | Proximity to popular schools | Priced aggressively — well documented |
| Scarcity | Limited resale supply in mature estates | Priced structurally |
| Liquidity | Faster resale, deeper buyer pool | Priced as a convenience premium |
| Lease profile | Age of the block, remaining lease | Priced, sometimes wrongly |
The practical consequence: the commute premium and the amenity premium are fused together in the transaction price. A buyer who says "I'm paying S$200,000 more for a 20-minute shorter commute" is usually paying for a lot more than that — and a buyer who says "I'm saving S$200,000 and my commute is only a bit longer" is usually undercounting something too.
Where the premium is largest
The relationship is strongest where the alternative is genuinely bad. Three patterns recur across the Singapore market:
- Strongest premium: homes within a short walk of an interchange station on a line that reaches the CBD without a transfer. The marginal minute saved here is expensive because the alternative is a two-bus, one-train journey.
- Moderate premium: homes near a single-line station with a direct CBD connection. Accessibility is real but not exceptional, and the market prices it accordingly.
- Weakest premium: homes near a station that requires an interchange to reach the CBD, or where the "near" is generous. The station exists; the time saving doesn't.
This is why two "MRT-adjacent" flats 3 km apart can behave completely differently in price. The market is not pricing the station — it is pricing the journey.
Reading the MRT Map as a Price Map
Singapore's employment geography
Commute time only means something relative to where people work. Singapore's employment is not evenly distributed; it clusters in a handful of nodes, each with a different catchment and a different wage profile.
| Employment hub | Dominant sectors | Districts with strong access |
|---|---|---|
| Raffles Place / Marina Bay | Finance, law, professional services | D1, D2, D4, D7, D9, D10 |
| Tanjong Pagar / Anson | Finance, tech, government-linked | D2, D3, D4, D5 |
| one-north / Buona Vista | Biotech, media, tech | D5, D10, D21, D9 |
| Jurong Lake District / Jurong East | Business park, logistics, agencies | D22, D21, D23, D5 |
| Changi Business Park / Airport | Aviation, back-office banking, logistics | D16, D17, D18 |
| Woodlands Regional Centre | Manufacturing, logistics, north-region services | D25, D26, D27 |
| Punggol Digital District | Tech, cyber, digital | D19, D18, D20 |
The important insight here is that the CBD is no longer the only anchor. As one-north, Jurong Lake District, Changi Business Park and the Punggol Digital District mature, the accessibility map becomes polycentric — and that changes which homes are "well-located."
A flat in Punggol is poorly located relative to Raffles Place. Relative to Punggol Digital District, it is excellent. If the district's job base grows as planned, some of that disconnect closes.
Approximate peak door-to-door times to Raffles Place
The table below gives rough peak-hour door-to-door estimates to Raffles Place MRT for representative towns. These are approximate indicators — actual times vary substantially by exact address, walking distance, interchange wait times and line performance. Verify against your own specific journey before relying on them.
| Town / area | Approx. one-way, peak (min) | Rail route | Transfers |
|---|---|---|---|
| Toa Payoh | ~20–25 | NSL direct | 0 |
| Bishan | ~25–30 | NSL direct | 0 |
| Queenstown | ~20–25 | EWL direct | 0 |
| Tampines | ~35–40 | EWL direct | 0 |
| Jurong East | ~35–40 | NSL or EWL direct | 0 |
| Sengkang | ~35–45 | NEL + transfer | 1 |
| Punggol | ~40–45 | NEL + transfer | 1 |
| Woodlands | ~45–55 | TEL + transfer | 1 |
| Choa Chu Kang | ~45–50 | NSL + transfer | 1 |
| Pasir Ris | ~45–50 | EWL direct | 0 |
Notice the pattern: the number of transfers matters more than the number of kilometres. A 22 km direct ride on the East-West Line often beats a 15 km journey requiring a change.
The connectivity blindness of PSF
Per-square-foot pricing treats every square foot as equivalent. It isn't. A 950 sq ft flat 25 minutes from Raffles Place and a 950 sq ft flat 50 minutes away can carry the same headline PSF in a comparison article and be entirely different products.
The market knows this at the transaction level — that's why the price gap exists — but individual buyers frequently don't translate it. They compare PSF within a district, which is sensible, and then across districts, which is where the distortion enters.
The Rail Dividend: How New Lines Reprice Neighbourhoods
New rail lines don't just add train services. They rewrite the relative price map, and they do it in predictable stages.
The pattern in Singapore has repeated across the North East Line in 2003, the Circle Line in 2009–2011, the Downtown Line in 2013–2017, and the Thomson-East Coast Line in stages from 2020 onwards. It generally runs:
- Announcement phase — speculative interest, thin transaction volumes, limited price movement. Buyers who need to see a train to believe in it stay away.
- Construction phase — disruption, noise, road diversions. Ironically, this is often when sentiment is weakest.
- Opening phase — the accessibility gain becomes real and measurable. Rents move first, then resale prices.
- Maturation phase — retail, schools and amenities cluster around the new station. The premium consolidates.
The lesson for buyers is that the market prices accessibility with a lag. A station opening in 2027 is not fully priced in 2025 — but a station that opened in 2019 almost certainly is.
The Thomson-East Coast Line as a live case study
The TEL has been opening in stages: Stage 1 in Woodlands in 2020, Stage 2 to Caldecott in 2021, Stage 3 through Stevens and on to Gardens by the Bay in 2022, and Stage 4 through Tanjong Rhu and on toward Bayshore in 2024, with Stage 5 to Sungei Bedok scheduled to follow.
Each stage delivered a step change in accessibility to a corridor that previously relied on buses or a long ride via alternate lines. Springleaf, Lentor, Mayflower, Bright Hill, Tanjong Rhu, Marine Parade, Siglap, Bayshore — these are areas where the commute-time-to-CBD variable has genuinely moved in the last few years.
Buyers who understood the timeline early captured the transition. Buyers who only noticed once the station opened paid the post-opening price.
The forward pipeline matters more than the map today
The stations that will reprice neighbourhoods over the next decade are the ones currently under construction:
- Jurong Region Line (from around 2027) — connecting Choa Chu Kang, Boon Lay, Jurong East and the western industrial belt
- Cross Island Line Phase 1 (targeted around 2030) — linking the northeast through Ang Mo Kio, Bukit Timah and Clementi to the west
- Circle Line Stage 6 (targeted 2026) — closing the loop between HarbourFront and Marina Bay
- TEL Stage 5 — finishing the eastern leg
For each of these, the relevant question for a buyer is not "is there a station nearby?" but "how many minutes does this remove from my actual journey, and how many people want to make that journey?"
The Commute Budget: Weighing Travel Time Against Housing Costs
Now to the practical part. How do you actually put a number on commute time?
Step 1: Count the hours
Start with arithmetic. Most full-time workers make roughly two trips a day, about 230 days a year (46 working weeks, allowing for leave and public holidays). Multiply through and the annual cost of a commute becomes very visible.
Annual Hours Spent Commuting (2 trips/day x 230 working days)
A 45-minute one-way commute — right at the planning target — consumes roughly 345 hours a year. That is over 14 full days of waking life, annually. Over a 25-year holding period, it is more than 8,600 hours.
Step 2: Value the hours
Transport economists commonly value commuting time at a fraction of the gross wage — often somewhere in the 40–60% range of the hourly wage rate. The discount reflects the fact that commute time is unpleasant but not as onerous as work itself, and that some of it can be used productively (reading, listening, answering messages).
Using MOM's reported median gross monthly income from work for full-time employed residents — in the region of S$5,500 in recent years, including employer CPF contributions — the arithmetic hourly rate works out to roughly S$29 per hour on a 44-hour week. Applying a 50% factor gives an indicative value of time of about S$14–15 per hour.
Step 3: Capitalise it
A recurring annual saving is worth a lump sum today. Capitalising at around 4% — a reasonable proxy sitting between current mortgage rates and a longer-run discount rate — converts annual savings into an equivalent price premium.
Capitalised Value of a 30-Minute Shorter Commute (one-way), by Hourly Value of Time
Step 4: Compare against the mortgage
This is where it gets interesting. Take a worked example, with all assumptions stated:
- Commute saving: 30 minutes each way, 60 minutes a day → 230 hours a year
- Value of time: S$15/hour → S$3,450 a year, or about S$288 a month
- Capitalised at 4%: roughly S$86,000
Now compare that to the mortgage. Suppose the shorter-commute home costs S$250,000 more, financed over 25 years at an illustrative 2.6%:
| Item | Monthly |
|---|---|
| Extra mortgage payment on S$250,000 | ~S$1,134 |
| Value of time saved (30 min each way) | ~S$288 |
| Net monthly cost of the shorter commute | ~S$846 |
Read that again. On pure time-value grounds, paying S$250,000 to save 30 minutes each way doesn't pay for itself — it costs roughly S$846 a month in net terms for 25 years.
That does not mean the premium is irrational. It means the premium is not primarily a commute premium. It's a bundle: amenity access, school proximity, scarcity of central resale supply, rental demand, liquidity at exit, and yes, some genuine time value. Buyers who think they're paying for the commute alone are misreading their own purchase.
Step 5: Sanity-check the non-time factors
Five Ways Buyers Misjudge Commute Time
Even buyers who accept the framework routinely get the inputs wrong. These are the five most common errors.
1. The interchange penalty
A journey with a transfer is not the sum of its legs. It carries waiting time — typically a few minutes per change — plus walking time within the station, plus the risk of missing a connection.
Stations like Dhoby Ghaut, Serangoon, Paya Lebar, Outram Park, Botanic Gardens and Jurong East are genuine accessibility multipliers. But a home on a line that requires an interchange to reach the CBD is often priced closer to a direct-connection home than it should be. The market's shorthand — "near MRT" — flattens this distinction.
Rule of thumb: treat each required interchange as adding roughly 5–8 minutes of effective journey time, on top of the nominal ride.
2. The first/last mile problem
A home "1.2 km from the MRT" is not a walkable home for most people in Singapore's climate. It is a feeder-bus home — and feeder buses mean waiting, queuing and variability.
The thirty seconds it takes to check the actual walking route on a map is the highest-return thirty seconds in any property search. Look for:
- Sheltered walkways — covered linkways exist on some routes and not others
- Crossing count — three-signal walks at 7:45am is a different experience from a straight path
- Feeder bus frequency — a 4-minute headway is fine; a 12-minute headway is a lifestyle change
3. Peak vs off-peak
Station-to-station timings on a map are not peak-hour timings. Peak-hour trains involve dwell time at crowded platforms, occasional holding, and the real possibility that you let two trains pass before boarding.
If you're evaluating a purchase, do the journey on a weekday at 8am. Not on a Saturday afternoon, not on a public holiday. The difference between the two can be ten minutes each way — which, by the arithmetic above, is over 75 hours a year.
4. Direction of travel and counter-peak flows
Commute time is not a property of a home. It is a property of a home–workplace pair.
A flat in Jurong East is mediocre relative to Raffles Place and excellent relative to Tuas or the Jurong Lake District. A flat in Tampines is unremarkable relative to the CBD and very strong relative to Changi Business Park or the airport.
This matters enormously for resale. If you buy based on your commute and later sell to buyers who work somewhere else, the accessibility premium you paid may not transfer.
The safer bet is accessibility that is broad, not accessibility that is specific to one employer or one route.
5. The "near MRT" vs "next to MRT" trap
There is a real premium for being steps from a station. There is also a real discount for being steps from a trackside unit. Noise, vibration and privacy all suffer, and buyers at resale price it in.
The sweet spot is usually 200–500 metres — close enough that the walk is trivial, far enough that the sound doesn't reach the bedroom window.
The Hybrid-Work Wrinkle
One honest complication: since 2020, the assumption that everyone commutes five days a week has weakened. Many Singapore employers now run hybrid arrangements, and a meaningful share of the workforce is in the office three or four days a week rather than five.
If commuting days fall from five to three, the annual hours of travel drop by 40%. In the worked example above, that cuts the value of a 30-minute saving from about S$3,450 to roughly S$2,070 a year — and the capitalised breakeven from ~S$86,000 to roughly S$52,000.
That should, in theory, compress the commute premium in far-flung estates. Whether it has done so conclusively is genuinely unclear from public data; some analysts argue hybrid work has widened the acceptable commute radius, redirecting demand toward larger, cheaper outer-ring homes rather than reducing their prices. Others argue the effect is concentrated among higher-income knowledge workers and barely touches HDB resale demand, which is driven by a different set of constraints.
What is defensible: the commute premium is not a constant. It is a function of how often people actually travel, and that variable has moved more in the last five years than in the previous twenty.
Where the Market May Be Mispricing Commute Time
If you accept the framework, three categories stand out as places where the price-to-commute relationship looks least settled.
Undervalued accessibility:
- Areas with good bus-based access that lack a rail station. Bus corridors along the Pan-Island Expressway and the major arterial roads can deliver CBD access in 35–40 minutes, but the market's rail bias means these homes trade at a discount to their actual accessibility.
- Areas within the catchment of an under-construction line where the opening date is still several years out — accessibility that isn't yet visible isn't yet priced.
- Estates with counter-peak advantages — strong access to a secondary hub like Jurong East, one-north or Changi Business Park that most buyers ignore because they're anchored on Raffles Place.
Possibly overvalued accessibility:
- Homes priced on one-line proximity that requires an interchange for most journeys. The premium is being paid for the station, not the journey.
- Edge-of-catchment addresses — technically near a station, practically a 15-minute walk. Sellers often ask for full proximity pricing; buyers often pay it without checking.
- Mature estates where the premium is driven by school and scarcity effects but attributed by the buyer to commute. If the school effect softens — through policy change or demographic shift — the commute alone may not support the price.
None of this is a prediction. It is a list of questions worth asking before you sign.
Food for Thought
1. If a shorter commute is worth S$86,000 but the market charges S$250,000 for it, what exactly are you buying with the other S$164,000 — and do you actually want it?
2. Would you still pay the central premium if your employer moved to Jurong Lake District, Changi Business Park or Punggol Digital District? If the answer is no, how much of your home's value is tied to a single address that isn't yours?
3. How many hours a year are you currently spending commuting, and what would you pay to have a third of them back? Now check whether your current home's price reflects that number.
4. If hybrid work settles at three days a week permanently, which parts of Singapore's price map look most mispriced — and would you rather be buying into that correction or selling out of it?
5. When you next view a flat, will you time the actual 8am journey — including the walk, the wait and the interchange — or will you trust the "5 min to MRT" line in the listing?
Conclusion
Commute time is the quietest line item in a Singapore property purchase. It doesn't appear in the option to purchase, the valuation report or the mortgage letter. But it is paid, month after month, in a currency that doesn't show up on a bank statement.
The households that do well out of Singapore residential property tend to be the ones that separate the components of the central premium — time, amenity, scarcity, schools, liquidity — and pay deliberately for the ones they value. The ones that struggle are the ones that buy a bundle without opening it.
The MRT map is a price map. Learning to read it is one of the highest-return skills a buyer can develop, and it costs nothing but a weekday morning and a stopwatch.