The email lands at 9.14am on a Tuesday. No warning, no prior signal — just a calendar invite that gets cancelled and a message from HR asking for a "quick chat". By 10am, a 34-year-old senior associate at a technology firm is clearing his desk, carrying out a cardboard box, and mentally running the numbers he has never had to run before: S$2,640 a month in mortgage instalments, 22 years left on the loan, and roughly S$41,000 sitting in his CPF Ordinary Account.
Multiply that by a few thousand in the same quarter and you have a retrenchment wave. And retrenchment in Singapore is not a rare event — MOM's Labour Market Reports have tracked tens of thousands of workers displaced annually over the past decade, with a record 26,110 retrenchments in 2020.
So does a wave of job losses crash the property market? The honest answer is more interesting than a simple yes or no. Historically, retrenchment waves in Singapore have moved rents far more than they have moved prices. The damage shows up first in the rental market, second in household balance sheets, and only much later — if at all — in headline property indices. This article unpacks the retrenchment cycle, traces how job losses travel through the Singapore property market, identifies which districts and households are actually exposed, and lays out a practical playbook for homeowners staring at an uncertain income.
The Retrenchment Picture in Singapore: What the Numbers Actually Say
Before we talk about property, we need a clean read on the labour data.
MOM defines a retrenchment as the termination of employment due to redundancy or reorganisation — not performance, not resignation. Retrenchments are reported quarterly in the Labour Market Report and released with a lag, which matters enormously for anyone trying to use them as a market signal.
Here is the recent annual picture, drawn from MOM's Labour Market Reports.
| Year | Total Retrenchments | Context |
|---|---|---|
| 2016 | 19,170 | Oil & gas and marine downturn |
| 2017 | 14,720 | Continued restructuring |
| 2018 | 10,730 | Tighter labour market |
| 2019 | 10,690 | Pre-pandemic low |
| 2020 | 26,110 | Pandemic shutdowns, aviation, hospitality, retail |
| 2021 | 7,820 | Rebound, hiring surge |
| 2022 | 6,440 | Tightest labour market in decades |
| 2023 | 14,320 | Tech, banking and fintech layoffs; highest since 2016 outside 2020 |
| 2024 | ≈13,000 | Eased from 2023's peak, with a Q4 pick-up |
| 2025 | Quarterly | Staying in the low-to-mid thousands per quarter |
Retrenchments in Singapore by Year (MOM)
A few things jump out.
- The 2020 spike was historic and anomalous. 26,110 retrenchments in a single year is roughly four times the 2022 trough. It was driven by a hard stop in aviation, tourism, F&B and retail — sectors with relatively lower property exposure.
- The 2023 wave looked different. Layoffs in technology, banking, fintech and professional services hit higher-income PMETs — precisely the group most likely to carry a private condo mortgage or a large HDB loan.
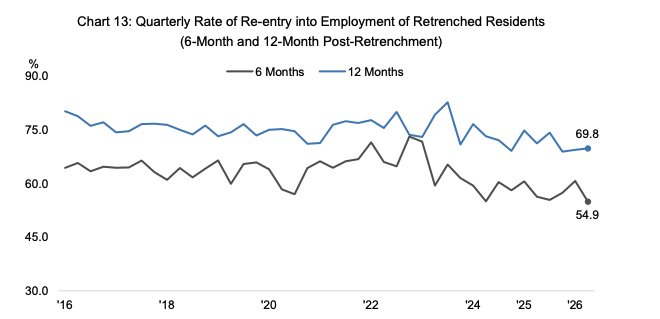
- Retrenchment is not unemployment. Singapore's overall unemployment rate has stayed low, hovering around 2% in recent years, because most retrenched residents re-enter work relatively quickly. MOM's data has typically shown around six in ten retrenched residents back in employment within six months, though the median re-entry time varies by age and sector.
- Retrenchment is not evenly distributed. A 26-year-old software engineer with no dependants and S$30,000 in savings experiences a layoff completely differently from a 48-year-old sole breadwinner servicing a S$1.4 million mortgage.
That last point is the crux. The property market does not respond to retrenchment as an aggregate. It responds to the financial position of the specific households that lose income.
The Historical Record: Do Retrenchment Waves Actually Sink Property Prices?
Let's go to the tape. Singapore has lived through at least five distinct retrenchment episodes in the past three decades, and each one interacted with the property market in a different way.
| Episode | Retrenchment Backdrop | Private Property Prices | HDB Resale Prices |
|---|---|---|---|
| 1997–98 Asian Financial Crisis | Sharp regional recession, mass layoffs | Fell substantially from the 1996 peak | Fell from the 1996 peak; multi-year slide |
| 2001–03 Dot-com bust + SARS | Sustained layoffs in electronics, IT, manufacturing | Prolonged multi-year decline | Five consecutive years of decline to mid-2000s |
| 2008–09 Global Financial Crisis | Banking and manufacturing layoffs; layoffs peaked in early 2009 | Fell by more than 10% over a few quarters, then rebounded | Dipped only modestly; recovered within about a year |
| 2020 COVID-19 | Record 26,110 retrenchments | Rose — URA price index up 2.2% for the year | Rose — HDB resale index up 5.0% for the year |
| 2023–25 Tech and finance layoffs | 14,320 in 2023, easing in 2024, moderate through 2025 | Continued rising, though at a slower pace | Continued rising to fresh record highs |
HDB Resale Price Index — Annual Change (%)
URA Private Residential Price Index — Annual Change (%)
The 2020 comparison is the single most instructive data point in Singapore property history. The country recorded its highest number of retrenchments in decades — and both HDB resale prices and private residential prices went up. That is not a normal outcome globally. In the United States, the 2008 crisis saw retrenchments, foreclosures and price declines feed each other in a downward spiral. Singapore simply did not follow that script.
Why? Because the type of shock matters enormously.
When Retrenchments Did Matter: 2000–2005
The one period where sustained job losses clearly dragged property prices was the early 2000s. Three forces stacked on top of each other:
- A multi-year retrenchment grind across electronics, manufacturing and IT as Singapore restructured.
- A supply overhang — a wave of new private completions plus a large BTO pipeline landing into weak demand.
- Weak sentiment compounded by SARS in 2003, which emptied malls and kept buyers at home.
HDB resale prices fell for several consecutive years, with the resale price index reportedly shedding roughly a fifth of its value between 2000 and 2005. Private home prices followed a similar, longer arc.
The lesson: retrenchments alone rarely move prices. Retrenchments combined with excess supply and weak sentiment do. That distinction is the whole game when you are trying to forecast what today's layoffs mean for your block or your condo.
Why the Singapore Property Market Absorbs Job Losses Better Than Most
There is a structural explanation for Singapore's resilience, and it is not luck. It is a set of interlocking buffers that most property markets simply do not have.
1. CPF Is a Forced Mortgage Reserve
Every month a working Singaporean's CPF Ordinary Account receives a mandatory contribution that can be used to service a housing loan. For a large share of HDB owners, the mortgage is paid entirely from CPF, with no cash outlay at all.
This is a genuine shock absorber. But it also creates a specific trap: when you lose your job, your income and your CPF inflow stop at the same moment. Households that have been servicing a mortgage from CPF alone suddenly discover they need to switch to cash — or that their OA balance is draining faster than they expected. The buffer exists, but it has a finite size.
2. Hard Borrowing Limits Curb the Worst Excesses
Singapore's macroprudential rules — introduced and tightened over the past decade-plus — mean borrowers enter a downturn with far less leverage than in 1998 or 2008.
- Total Debt Servicing Ratio (TDSR): 55% of gross monthly income across all property and other debt.
- Mortgage Servicing Ratio (MSR): 30% of gross monthly income for HDB flats and new ECs on bank loans.
- Loan-to-Value limits: generally 75% for a first housing loan, lower for second and third properties.
- HDB loan interest rate pegged at 0.1 percentage points above the CPF Ordinary Account rate (currently 2.6%), insulating HDB borrowers from rate shocks.
These rules deliberately keep households from being maximally exposed. The corollary is that when a household does hit trouble, it is usually not because the loan was reckless — it is because the income disappeared.
3. Owner-Occupation Dominance
The overwhelming majority of Singapore's housing stock is owner-occupied HDB flats. Owner-occupiers with a roof over their heads and equity in their flat behave very differently from speculative investors with multiple leveraged units. They do not sell into a downturn if they can avoid it — and because most owner-occupiers can avoid it, forced selling stays low.
4. Policy Levers Arrive Fast
Singapore has a documented history of intervening quickly: mortgage deferment measures, HDB instalment restructuring, and the willingness of banks and the authorities to engage borrowers early. In the 2020 pandemic, the temporary relief measures for property loans prevented a wave of defaults from ever materialising.
5. The Rental Market Is Elastic
Because there is deep, persistent demand for rental housing — from expatriates, PRs, singles, and households between homes — an owner under stress has a middle option that many markets lack: rent out a room, or right-size and rent out the flat.
How a Retrenchment Actually Travels Through the Property Market
Notice where the leverage point sits: most of the action happens between the job loss and the restructuring decision. That is where advice, planning and early action actually change outcomes — not at the point of a forced sale.
The First Domino Is Usually Rent, Not Price
If you want an early read on whether job losses are biting the property market, do not start with the price index. Start with rents.
Rental demand responds to employment almost immediately because leases are short — typically one to two years for residential, sometimes just six months for co-living. Prices, by contrast, are sticky: sellers hold, and owners who are not forced to sell simply do not transact.
Where rental demand is most job-sensitive
The private residential rental market in Singapore has a strong expatriate component. When multinationals cut regional headcount, freeze relocations, or convert expatriate packages into local terms, the knock-on effect on rental demand is direct.
URA's private residential rental index has been softening from its 2023 peak — reportedly declining by around 2% in 2024 and continuing to ease into 2025 — even as capital values kept rising. That divergence between rents and prices is the single clearest fingerprint of a cooling labour market for higher-income professionals.
At the same time, HDB rental volumes have been running near record highs as more owners list spare bedrooms, and as locals themselves turn to renting while waiting out leases, MOPs or BTO completions. That is a different, more local demand pool — and it has proven remarkably resilient.
District-Level Exposure
Different parts of Singapore are wired to different job engines. Here is a rough map of where retrenchment pressure concentrates first.
| Segment | Job Engine It Depends On | Rental Sensitivity | Notes |
|---|---|---|---|
| Districts 1, 2, 4, 9, 10, 11 | Finance, legal, MNC regional HQs | High | Expat-heavy tenancies; first to see lease non-renewals |
| one-north / Dover / Buona Vista fringe | Tech, biomedical, research | High | Condo cluster with heavy investor-owner rental pool |
| Punggol / Sengkang / Jurong East | Tech, manufacturing, logistics | Medium | Growing local rental demand partially offsets expat loss |
| Suburban OCR mass-market condos | Broad domestic employment | Lower | Owner-occupier heavy; rents supported by locals |
| CBD-adjacent co-living and serviced apartments | Mobile professionals, project-based hires | Very high | Shortest lease terms, quickest to correct |
The practical implication: a retrenchment wave in banking and tech shows up in District 9 rents and one-north occupancy long before it shows up in a Punggol BTO's resale price.
The Room-Rental Buffer — With a Catch
Renting out a spare bedroom is one of the most effective defences a distressed HDB owner has. But the rules have tightened for newer flats.
Under the flat classification framework introduced from the October 2024 BTO exercise, Standard flats follow the traditional rules, while Plus and Prime flats carry a 10-year Minimum Occupation Period and stricter conditions on renting out the whole flat. That means a household in a Prime or Plus flat has a narrower set of options when income disappears in year four or five — and would need HDB's approval to rent out bedrooms.
For buyers weighing a BTO today, that is a real, under-discussed trade-off: the subsidy and location premium of a Plus or Prime flat comes with reduced flexibility in exactly the scenario this article is about.
Mortgage Stress and Defaults: How Bad Does It Actually Get?
Here is where the data is genuinely reassuring — at the aggregate level.
MAS has consistently reported that housing loan non-performing loan ratios at Singapore banks remain low, typically well under 1% of the housing loan book. By international standards, that is extraordinarily contained. HDB's own mortgage arrears rates, while higher than bank NPLs because HDB lends to a broader income spectrum, have also remained manageable, supported by CPF and HDB's hardship measures.
Mortgagee sale listings — the visible end-state of a default — have remained a very small slice of overall transactions in recent years. Against tens of thousands of HDB resale transactions and private resales annually, mortgagee sales number in the dozens to low hundreds. They make headlines because they are dramatic, not because they are statistically significant.
But aggregate data hides individual pain, and the aggregate is not the right lens for a household making a decision. Consider an illustrative scenario:
Assumptions: a couple earning a combined S$12,000 a month, servicing a S$5,400 monthly instalment on a S$1.4 million private condo (roughly 45% of gross income — comfortably within TDSR at origination, but not a small number).
| Scenario | Household Income | Instalment as % of Income | Practical Room |
|---|---|---|---|
| Both employed | S$12,000 | 45% | Tight but workable |
| One retrenched, savings bridge | S$7,000 | 77% | Not sustainable beyond a few months |
| One retrenched, finds work at 80% pay | S$10,600 | 51% | Workable with discipline |
| One retrenched, restructures to 35-year tenure | S$7,000 | ~62% | Still stretched; CPF must top up |
| One retrenched, rents out a room at S$1,500 | S$8,500 | ~46% | Back within a manageable band |
The takeaway is not that the scenario is hopeless. It is that the gap between "fine" and "crisis" is often one room rental or one restructuring conversation wide — and that a household which has never modelled the single-income case is flying blind.
A Critical Misconception: HPS Does Not Cover Retrenchment
The Home Protection Scheme (HPS) is a mortgage-reducing insurance scheme for HDB flat owners. It pays out on death or total permanent disability — it does not cover retrenchment or loss of income.
Many HDB owners assume otherwise. If your household's resilience plan is "we have HPS", you effectively have no plan for a layoff. The relevant products are mortgage insurance with retrenchment riders, income protection policies, or simply a larger cash buffer.
Who Is Actually at Risk? A Profile-by-Profile Read
The market average tells you almost nothing about your own exposure. Here is a more useful breakdown.
| Household Profile | Exposure to a Layoff | Why |
|---|---|---|
| Dual-income PMET couple, new launch condo, S$1.5m loan | High | Both incomes may be in the same cyclical sector; large absolute instalment; SSD window still open |
| Single-income family, 4-room resale HDB, CPF-funded mortgage | Medium | Lower absolute instalment; CPF buffer; room rental is a viable fallback |
| Recent upgrader who sold HDB and bought condo | High | Reduced cash reserves after upgrade; new loan at higher quantum |
| Retiree landlord relying on rental income | Medium–High | Rents soften first; no salary to fall back on |
| Young couple holding a BTO under construction | Low | Progressive payment schedule; instalments scale with construction stage |
| Self-employed or commission-based owner | High | Income verification already harder; no retrenchment benefits; no notice period |
| Owner in a Plus or Prime BTO flat within 10-year MOP | Medium | Cannot rent out the whole flat or sell in the open market |
The most exposed household is not the lowest-income one. It is the highest-leverage household with the least diversification of income source.
If the Layoff Happens: A Practical Playbook for Homeowners
Panic is expensive. Sequence is everything. Here is a structured approach.
Step 1: Build the Real Numbers (Week 1)
- Monthly instalment, and how much of it is currently paid from CPF versus cash.
- CPF OA balance, and how many months of instalments it can cover on its own.
- Cash savings, excluding any money earmarked for insurance premiums, school fees or parents.
- Total monthly essentials — not your previous lifestyle, your survival number.
- Retrenchment benefits: check your employment contract and the Tripartite Guidelines on Mandatory Retrenchment Notifications, which require employers with 10 or more employees to notify MOM of retrenchments within five days. Retrenchment benefit norms under tripartite guidance are typically two weeks to one month of salary per year of service for employees with at least two years' service.
Step 2: Talk to the Lender Early — Before You Miss a Payment (Weeks 2–4)
This is the single highest-leverage action, and it is the one most people delay out of embarrassment.
- Banks in Singapore have generally been willing to discuss restructuring with borrowers who engage proactively. Options include extending the loan tenure (which lowers the monthly instalment), switching from a floating to a fixed package, or temporary instalment relief.
- HDB has standing assistance measures for flat owners in financial hardship, including instalment deferment and tenure extension. Approach HDB directly through the branch handling your loan.
A missed payment that shows up in your credit bureau record is far worse than a phone call made three weeks earlier.
Step 3: Use Every Structural Buffer You Have (Months 1–3)
- CPF OA top-ups: if your OA is depleted and you have spare cash, a voluntary top-up restores the buffer — but weigh this against liquidity needs, because CPF cash is not accessible for daily expenses.
- Room rental: for HDB owners, renting out a spare bedroom (subject to eligibility and registration) can meaningfully offset an instalment. For condo owners, renting a room is generally permitted subject to MCST rules.
- Right-sizing: selling a larger flat for a smaller one releases equity. But run the full cost: seller's stamp duty of 4–12% applies if you sell within three years of purchase, plus agent commission, legal fees and the CPF accrued interest you must return.
Step 4: Avoid the Expensive Mistakes
- Do not borrow from unlicensed moneylenders. The cost of a bad bridge loan dwarfs any mortgage restructuring benefit.
- Do not sell in a panic. A distressed sale in a soft quarter can cost more than a year of careful bridging.
- Do not raid your retirement savings without understanding accrued interest. CPF monies used for housing must be returned with accrued interest on sale — a detail that regularly surprises sellers.
- Do not assume you must handle it alone. Family support remains one of the most underrated buffers in the Singapore system.
What to Watch: Leading Indicators of Property-Market Stress
Retrenchment statistics arrive with a lag, and they tell you what already happened. If you want an early read on whether job losses are beginning to pressure the property market, watch this sequence.
| Indicator | Source | What a Deterioration Looks Like |
|---|---|---|
| Quarterly retrenchments and re-entry rate | MOM Labour Market Report | Rising retrenchments and falling re-entry within six months |
| Job vacancy to unemployed person ratio | MOM | Falling below 1.0 signals a genuinely loose labour market |
| URA private residential rental index | URA quarterly | Two or more consecutive quarters of decline |
| HDB median rents and rental volume | HDB | Rents flattening while volume spikes (owners rushing to monetise) |
| Housing loan NPL ratio | MAS Financial Stability Review | Any sustained move above the recent low base |
| Sub-sale and mortgagee sale listings | Property portals, bank notices | Rising mortgagee listings relative to total transactions |
| HDB resale volume | HDB quarterly | Volume falling sharply while prices hold — a sign sellers are withdrawing |
The order matters. Rents move first, transaction volume second, NPLs third, and prices last — if at all. By the time prices visibly fall, most of the adjustment has already happened in the rental market.
Food for Thought
-
If your household lost its larger income tomorrow, how many months could you service the mortgage before you touched your emergency fund? Most people answer this question with a guess. The ones who answer with a number are the ones who restructure early.
-
Is your mortgage actually CPF-funded, or does it just look that way? When CPF inflows stop, an OA-funded mortgage silently becomes a cash mortgage. Have you modelled the switch?
-
Would you rather own a subsidised Plus or Prime flat with a 10-year MOP, or a Standard flat you can rent out in year six? The subsidy is visible. The lost optionality in a downturn is not — until you need it.
-
If rents keep softening while prices keep rising, which one is right? History suggests the rental market is the more honest signal of labour-market health. Prices can defy gravity for years on the back of owner-occupier behaviour and policy — but rents cannot be propped up indefinitely.
-
What would you actually do with a retrenchment package? Pay down the loan, extend the runway, or upskill? The answer changes depending on whether your sector is in a structural or a cyclical downturn — and almost nobody asks that question in the first week.