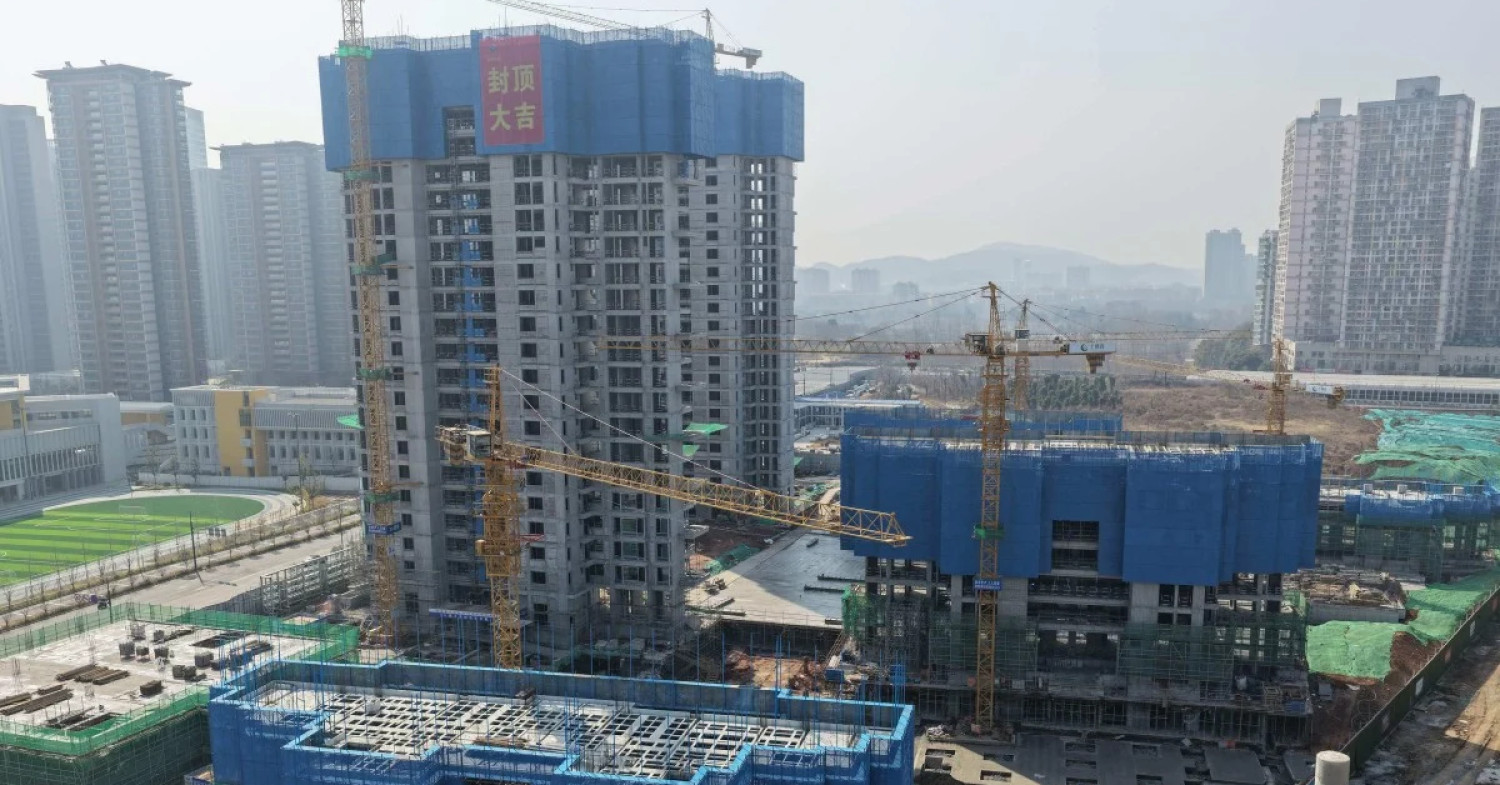
In September 2021, a Chinese developer called Evergrande missed an interest payment on offshore bonds. Within months, what looked like a single company's balance-sheet problem had metastasised into the deepest and longest downturn in the history of the world's largest property market. Country Garden followed. Sales across China's 70 major cities slumped. Entire city districts in Tier-3 towns emptied of cranes and buyers.
For most Singaporeans, that felt like a story happening very far away. It isn't. The Singapore property market sits at the receiving end of three different currents set loose by China's housing bust: capital looking for somewhere safe to land, a luxury demand pool that has thinned or shifted, and a global disinflation impulse that has fed directly into the mortgage rates Singaporeans pay. Understanding how those currents move is now part of understanding your own housing decision — whether you're a 32-year-old eyeing a BTO in Tengah or a family trading up to a condominium in Bukit Timah.
This article unpacks the linkage in detail: the scale of China's contraction, what it has done to foreign buyer participation in Singapore, where Chinese capital has actually gone, how it has reshaped interest rates, and what would need to happen for the picture to flip.
The Scale of the Slowdown: Why China's Housing Bust Is Different
China's property sector was never just a domestic industry. At its 2021 peak, nationwide commercial housing sales hit roughly RMB 18.2 trillion — larger than the annual GDP of most G20 economies. Construction and property-related activity accounted for an estimated 20% to 30% of Chinese GDP once you include upstream industries like steel, cement, glass, and white goods.
Then it stopped growing.
China Nationwide Commercial Housing Sales (RMB trillion)
As the chart shows, sales had more than halved from the 2021 peak by end-2024, based on China's National Bureau of Statistics data. That is not a cyclical dip. It is a structural repricing of the single largest asset class in the world.
How It Unfolded
The trigger is usually traced to the "Three Red Lines" policy introduced in August 2020, which capped developers' leverage ratios. The intent was to deflate a speculative bubble gently. The effect was to cut off the credit that developers had been using to fund land purchases, which in turn cut off local government land-sale revenue, which in turn squeezed municipal spending — a chain reaction that fed back into consumer confidence.
Three features make this downturn unusually persistent:
- It is a confidence crisis as much as a credit crisis. Chinese households hold roughly 70% of their wealth in property. When prices fall, households feel poorer and save more. When they save more, the deflationary spiral deepens.
- Inventory overhang is enormous. Estimates of unsold completed housing in China range from 20 to 30 million units in some assessments, concentrated in lower-tier cities where demographics are also deteriorating.
- Fiscal capacity is constrained. Local governments derived a large share of revenue from land sales. That revenue stream has collapsed alongside developer demand.
For Singapore, the key takeaway is not the magnitude of the collapse itself. It is the behavioural response of Chinese households and businesses — because that is what determines where the money goes next.
Three Channels From Shanghai to Singapore
The transmission mechanism from Chinese property to Singapore property runs through three distinct channels, and they operate on different time horizons.
- The capital channel — wealthy Chinese households and family offices reallocating wealth offshore, with Singapore among the top destinations.
- The demand channel — the composition of foreign buyers in Singapore's private residential market, particularly in the Core Central Region.
- The rate channel — China's export of deflation into global goods prices, which has helped pull global inflation lower and, indirectly, Singapore's mortgage benchmark rates down with it.
Channels 1 and 2 act quickly, sometimes within quarters. Channel 3 works over one to three years. Let's take each in turn.
Channel 1: Capital Reallocation and Singapore's Pull
The Mechanics of Chinese Outflow
China maintains capital controls that limit individuals to USD 50,000 per year in foreign exchange conversion for personal use. That cap has always been porous at the top end of the wealth distribution — routed through offshore entities, trade structures, family trusts, and overseas holding companies — but it sets the tone: getting money out of China is deliberate, costly, and mostly the domain of the affluent.
The property downturn supercharged the incentive. When domestic property was a one-way bet yielding double-digit annualised returns in Tier-1 cities, there was little reason to move money out. When domestic property became a wealth destroyer, that calculation inverted.
Singapore's attractions in this context are well documented:
- Rule of law and currency stability. The Singapore dollar has been a notably stable store of value in a region of volatile currencies.
- Proximity and cultural familiarity. A majority-Chinese population, Mandarin-speaking business environment, and a four-to-five-hour flight from major Chinese cities.
- A credible financial ecosystem. Banking, trust, and family-office infrastructure that can absorb large pools of capital.
- Education and residency pathways. International schools, PR pathways, and the Global Investor Programme.
The Family Office Boom
The clearest quantitative signature of Chinese wealth migration into Singapore is the surge in single family offices (SFOs) — private vehicles set up to manage the wealth of one family.
Estimated Number of Single Family Offices in Singapore
Figures above are based on Monetary Authority of Singapore disclosures as reported in the media and should be read as indicative rather than precise. The direction, however, is unambiguous: the number of SFOs has multiplied several times over in the space of a few years.
Singapore has also been repeatedly ranked among the top destinations globally for net inflows of high-net-worth individuals, per Henley & Partners' migration reports, with net inflows running in the thousands per year through the early 2020s.
Not all of that is Chinese. But China is consistently identified as one of the two or three largest source markets, alongside India and Indonesia.
The 60% Wall
Crucially, not all of this wealth migrates into residential property — and since April 2023, the tax system has made sure of it.
On 27 April 2023, Singapore raised Additional Buyer's Stamp Duty for foreigners from 30% to 60% — the highest in the world for any major market. Here's the current structure:
| Buyer Profile | 1st Property | 2nd Property | 3rd+ Property |
|---|---|---|---|
| Singapore Citizen | 0% | 20% | 30% |
| Singapore PR | 5% | 30% | 35% |
| Foreigner (non-PR) | 60% | 60% | 60% |
| Entities | 65% | 65% | 65% |
| Housing Developers | 35% | 35% | 35% |
Source: IRAS. Citizens of the US, Iceland, Liechtenstein, Norway, and Switzerland receive citizen-level treatment under respective Free Trade Agreements.
The effect on the arithmetic of a purchase is stark. On an S$3 million condominium:
- A Singapore citizen buying their first home pays S$0 in ABSD.
- A non-PR foreigner pays S$1.8 million in ABSD — a 60% premium on the sticker price.
That is a deliberate policy choice: the government has, in effect, told foreign capital that Singapore's mass residential market is not open to it on an investment basis. Which means the capital channel no longer flows into the mid-market. It flows into a much narrower set of assets instead.
Where the Money Actually Goes Now
In practice, Chinese-linked capital in Singapore now takes one of five routes:
- Permanent Residency and citizenship conversion. Many Chinese HNWIs move to Singapore on Employment Passes, convert to PR, and then buy residential property at PR or citizen ABSD rates. This is arguably the single most important channel — it converts a 60% tax into a 5% or 0% one, and it takes three to five years.
- Ultra-prime residential. At the very top of the market — Good Class Bungalows, Sentosa Cove waterfront homes, and super-penthouse units — a 60% ABSD is a rounding error relative to the asset's scarcity value. The buyer pool shrinks, but prices at the apex have proven remarkably sticky.
- Commercial and industrial property. Shophouses, strata offices, and industrial assets carry no residential ABSD and have drawn significant Chinese family-office capital. Shophouse transactions in Districts 1, 2, 7, and 8 have been a notable beneficiary.
- Non-property allocations. Equities, fixed income, private credit, and Singapore-domiciled funds, many of them structured through the family office vehicles cited above.
- Regional spillover. Johor's Forest City and the Johor–Singapore Special Economic Zone have absorbed a portion of the demand that used to consider Singapore's entry-level condominium market. The JS-SEZ agreement signed in January 2025 and the special financial zone provisions around Forest City are directly relevant to this dynamic.
Channel 2: What the Foreign Buyer Data Actually Shows
Here is where the conversation usually gets sloppy. Anecdote suggests "Chinese buyers are everywhere." The transaction data tells a more complicated story.
The Headline Numbers
Non-PR foreigners have historically accounted for a single-digit share of private non-landed residential transactions in Singapore — typically in the region of 5% to 7% in the years leading up to 2023, according to URA REALIS data as reported in the media. Singapore's residential market is overwhelmingly driven by resident demand.
| Period | Approx. non-PR foreign share of private non-landed transactions | Notes |
|---|---|---|
| 2019–2021 | ~5%–6% | Stable pre-pandemic and pandemic-era range |
| 2022 | ~6% | Post-reopening rebound in foreign interest |
| 2023 (full year) | ~4%–5% | ABSD hike to 60% in April 2023 |
| 2024 | ~2%–3% | Full-year effect of the 60% ABSD |
Indicative ranges based on URA REALIS transaction data as reported in the media. Actual figures vary by quarter, segment, and definition of "foreigner."
Within that foreign cohort, mainland Chinese buyers have consistently ranked as the largest single nationality group in recent years, typically accounting for somewhere in the region of one-fifth to one-quarter of foreign purchases of private non-landed homes, with Malaysians, Indonesians, Indians, and Americans rounding out the top five.
What's important to notice is the interaction between the two facts:
- Chinese buyers are the largest foreign nationality group.
- Foreigners are a small share of the total market.
Both can be true simultaneously, and the policy implication is significant. Even a substantial shift in Chinese buyer behaviour moves a segment of the market meaningfully — particularly the Core Central Region — without moving the overall national price index very much.
Where the Concentration Actually Bites
Chinese buyer activity in Singapore is geographically concentrated. The districts that typically see the highest foreign participation rates include:
- District 9 (Orchard, River Valley, Cairnhill) — prime core, heavy new-launch supply, historically the deepest foreign buyer pool.
- District 10 (Bukit Timah, Tanglin, Holland) — established prime, popular with families relocating for schools.
- District 1 (Raffles Place, Marina Bay) — financial-district living, attractive to single professionals and investors.
- District 4 (Sentosa, Harbourfront) — the only place where foreigners can, with approval, own landed property.
- District 15 (Katong, Joo Chiat, Amber Road) — an increasingly popular lifestyle alternative with a lower entry price than the traditional prime core.
In the Core Central Region (CCR), foreign buyers have at times accounted for a meaningfully larger share of new-launch sales than the islandwide average — particularly in projects with strong China-facing marketing channels. This is why the CCR's price performance diverges from the Outside Central Region (OCR) at times when foreign demand shifts.
The Post-ABSD Adjustment
After April 2023, foreign purchase volumes fell sharply — media reports citing URA data suggested declines of 60% to 80% in non-PR foreign transactions in the quarters immediately following the hike. Two things followed:
- Developers pivoted marketing towards resident upgraders. New launch marketing budgets shifted from Shanghai and Hong Kong to Singaporean HDB upgraders and local investors.
- The ultra-prime tier held up better than the upper-mid tier. Which is exactly what you'd expect: the 60% ABSD is a fixed cost that becomes proportionally smaller the more expensive the asset.
This is a helpful reminder of something important: Singapore's residential market is not a Chinese buyer market. It is a Singaporean resident market with a foreign fringe. The fringe matters enormously in specific micro-markets — and barely at all in others.
Channel 3: How China's Deflation Reaches Your Mortgage
The third channel is the least discussed and, for the average Singaporean household, potentially the most consequential.
China Is Exporting Disinflation
China's consumer price index rose just 0.2% in 2023 and 0.2% in 2024, according to the National Bureau of Statistics. Producer prices have been in outright deflation for an extended stretch. A large economy running near-zero inflation while producing a substantial share of the world's manufactured goods exerts downward pressure on global goods prices.
This matters because a meaningful part of the inflation surge of 2022–2023 was goods-driven, then services-driven. As goods disinflation from China feeds through global supply chains, it helps pull headline inflation down in importing economies — including Singapore, where imports are a large share of the consumption basket.
The Rate Chain
The chain runs roughly like this:
- China's slowdown caps global growth expectations and commodity demand.
- Global goods disinflation pulls headline inflation lower across developed markets.
- Central banks — principally the US Federal Reserve — gain room to ease.
- Singapore's floating-rate mortgages, benchmarked to SORA, track US dollar short rates closely because of the S$NEER policy framework's emphasis on exchange rate rather than interest rate management.
- Mortgage instalments fall.
The Fed cut rates three times in late 2024, taking the federal funds target to 4.25%–4.50%, before pausing in 2025 as tariff-driven inflation uncertainty re-emerged. Three-month SORA, which peaked near 3.7% in late 2023 and early 2024, has since eased into the low-2% range.
The practical effect for a household:
| Loan Quantum | Rate Change | Monthly Instalment Change (25-year tenure) |
|---|---|---|
| S$800,000 | 3.7% → 2.5% | ~S$500 lower |
| S$1,200,000 | 3.7% → 2.5% | ~S$750 lower |
| S$1,500,000 | 3.7% → 2.5% | ~S$940 lower |
Illustrative calculations assuming a standard amortising loan. Actual instalments depend on loan structure, tenure, and any lock-in provisions.
For a young couple with a S$1.2 million mortgage, that is roughly S$9,000 a year back in cash flow. That single number probably matters more to their lived experience than any shift in Chinese buyer sentiment — which is precisely the point.
Why This Cuts Both Ways
There's a catch. Lower rates support affordability, which supports prices. Singapore's private residential price index rose 10.6% in 2021, 8.6% in 2022, 6.8% in 2023, and 3.9% in 2024, per URA data.
URA Private Residential Property Price Index: Annual Change (%)
Notice the pattern: the pace of price growth has moderated for three consecutive years even as rates began falling. That suggests the dominant driver of Singapore residential prices is domestic demand and supply, not the cost of capital alone. Falling rates are a tailwind, not the engine.
The Landed and Ultra-Prime Market: A Different Animal
If you want to see Chinese capital's footprint most clearly, look at the top of the market.
Good Class Bungalows
GCBs are Singapore's most restricted residential asset class — there are only around 2,800 of them islandwide, and the pool of buyers is limited by price (typically S$30 million and up), planning restrictions, and the fact that foreigners generally cannot buy them without approval.
Chinese buyers have been identified in media reports among the notable foreign purchasers of GCBs in recent years, alongside Indonesian, Indian, and Malaysian families. The volume is tiny — a handful of transactions a year — but the price impact per transaction is large.
Sentosa Cove
Sentosa Cove is the only place in Singapore where foreigners can own landed property, subject to Land Dealings Approval Unit (LDAU) approval. It has historically been a bellwether for foreign sentiment, and a strong Chinese presence there was a feature of the 2010s. In recent years, Sentosa Cove has traded in a wider range, with a broader mix of nationalities and a number of long-held units coming to market.
Shophouses
Perhaps the most interesting shift: Chinese family-office capital has flowed meaningfully into conservation shophouses, which carry no residential ABSD. Transactions in Districts 1, 2, 7, and 8 have attracted institutional and family-office buyers from China, Hong Kong, and elsewhere. Yields are modest, but the assets serve as a capital preservation vehicle with tangible Singapore exposure — precisely the profile a risk-averse Chinese HNWI is looking for.
This is a useful illustration of a broader principle: capital adapts to tax. When you tax a channel, capital finds an adjacent one. It rarely disappears.
What Could Break This Thesis
Any honest analysis has to include the ways this could be wrong.
1. A Chinese Recovery
If China's stimulus measures — mortgage rate floor removal, down payment reductions to 15% for first homes, "white list" project funding, and various local-government demand-side measures — succeed in stabilising prices, the incentive to move capital offshore weakens considerably. A stabilised Chinese property market would likely reduce net HNWI outflows to Singapore.
2. Tightening Chinese Capital Controls
Beijing has periodically cracked down on informal outflow channels, including through underground banking and cryptocurrency. A sustained tightening would reduce the volume of capital reaching Singapore regardless of intent.
3. ABSD Isn't Going Anywhere
The 60% foreigner ABSD was designed to be prohibitive and has been politically popular. It is unlikely to be relaxed in the near term, which caps how much foreign capital can flow into the residential market even if sentiment improves.
4. Domestic Demand Dominates
The single most important fact about Singapore's private residential market is that resale and new-launch demand is driven by household formation, HDB upgraders, PR conversion, and income growth. Foreign buyers — of any nationality — are a marginal, if visible, influence.
5. Supply Is the Swing Factor
Government Land Sales supply, BTO pipeline, and en-bloc activity determine the medium-term price trajectory more than any external capital flow. Singapore's supply-side management has historically been the dominant stabiliser.
Signals to Watch Over the Next 12–24 Months
| Indicator | Where to Find It | Why It Matters |
|---|---|---|
| URA quarterly private residential price index | URA quarterly release | The headline trend across CCR, RCR, OCR |
| Non-PR foreign transaction share | URA REALIS | Measures the live impact of the 60% ABSD |
| China new home sales and 70-city price index | China NBS monthly | The source of the pressure |
| 3-month SORA | ABS / MAS | Direct input into floating-rate mortgage costs |
| Single family office counts | MAS annual disclosures | Proxy for wealth migration pipelines |
| PR and citizenship approvals by source country | ICA annual report | Converts foreign demand into resident demand |
| Johor–Singapore SEZ news flow | MTI / media | Alternative destination for regional capital |
| GCB and Sentosa Cove transaction volumes | URA caveats | Ultra-prime sentiment gauge |
Food for Thought
-
If Chinese capital is being redirected from the mass condo market into shophouses and commercial assets, has the 60% ABSD solved the problem it was designed to solve — or simply moved it?
-
Singapore's private home prices grew more slowly in 2024 than in any of the prior three years, even as mortgage rates fell. If lower rates aren't lifting prices, what actually is — and how long can that driver hold?
-
Many Chinese HNWIs who arrive on Employment Passes convert to PRs within three to five years, cutting their ABSD exposure from 60% to 5%. Is the 60% rate better understood as a permanent barrier, or a five-year toll?
-
China's deflation has helped pull global inflation down and, indirectly, your mortgage rate. If China reflates, that tailwind reverses. Are Singaporean households positioned for a world where the direction of that pressure flips?
-
If the Johor–Singapore Special Economic Zone matures as a genuine alternative for regional capital, does that help or hurt Singapore residential prices — through substitution, or through the broader regional agglomeration effect?
The Bottom Line
China's property slowdown is not a Singapore property story. It is a global capital story that Singapore happens to sit inside. The 60% ABSD has effectively ring-fenced the residential market against the most direct form of foreign capital — and yet the second-order effects continue to move through the system: through family offices, through PR conversion, through the ultra-prime tiers, through commercial property, and most importantly through the global rate environment that determines what you pay each month on your mortgage.
The investor takeaway is not "buy because Chinese money is coming." It is subtler: the composition of demand in specific micro-markets shifts before the headline index does. CCR new launches with high foreign exposure behave differently from OCR mass-market projects. Districts with heavy foreign buyer concentration have different downside and upside profiles. Understanding which bucket an asset sits in is more useful than tracking the national average.