Nobody hands you an air quality report when you step into a showflat. The floor plan shows you the bedrooms, the brochure shows you the MRT line, the price list shows you the PSF — and none of it tells you what you will breathe roughly 20,000 times a day for the next 20 years.
Yet in Singapore, where most of us spend the overwhelming majority of our lives within a few kilometres of home, the air outside your window is one of the few property attributes you cannot renovate, cannot upgrade, and cannot negotiate. You can hack a wall down. You cannot hack a smokestack.
Air quality is also quietly becoming a more visible part of the national conversation. The 2023 haze episode brought the PSI back into daily vocabulary. Singapore's push toward cleaner-energy vehicles, the consolidation of port operations at Tuas, and a denser urban landscape have all shifted the baseline. And as we head into 2026, the question "which districts breathe best?" is being asked by buyers, tenants and upgraders alike — usually right after they've asked about the MRT.
So let's answer it properly. Not with vibes, but with the geography, the monitoring framework, and an honest look at whether clean air actually shows up in property prices.
What "air quality" actually means in Singapore
Singapore does not have one air quality problem. It has several, layered on top of each other, operating at completely different scales and timeframes.
The National Environment Agency (NEA) operates an islandwide network of ambient air quality monitoring stations and publishes readings through its myENV app and air quality pages. The headline number most people know is the Pollutant Standards Index, or PSI — a composite index calculated from six pollutants:
- PM2.5 — fine particulate matter, the fraction that penetrates deep into the lungs and bloodstream
- PM10 — coarser particulate matter
- Sulphur dioxide (SO₂)
- Carbon monoxide (CO)
- Ozone (O₃)
- Nitrogen dioxide (NO₂)
The PSI is not an average. It is the highest of the six sub-indices. That matters enormously: on a haze day, PM2.5 dominates and pushes the PSI up. On a clear, sunny afternoon, ozone — formed photochemically from traffic and industrial emissions in strong sunlight — can quietly become the binding pollutant. Two days with the same PSI score can have entirely different chemistry.
Singapore's PSI scale: upper bound of each descriptor band
The critical thing about that scale is how much headroom sits between "Moderate" and "Unhealthy". Most Singapore days, including most days with visible haze, land in the Moderate band. The Unhealthy band is reserved for the genuinely bad episodes.
At the pollutant level, the 24-hour PM2.5 bands give a clearer picture of what those PSI descriptors mean in physical concentration terms.
24-hour PM2.5: concentration at which each band begins (µg/m³)
Note how wide the Moderate band is. A reading of 14 µg/m³ and a reading of 54 µg/m³ both show up as "Moderate" on the PSI — but as an air quality experience, they are not remotely the same. This is one reason district-level comparisons based on PSI alone tend to look deceptively flat.
NEA's five regions — and why they frustrate buyers
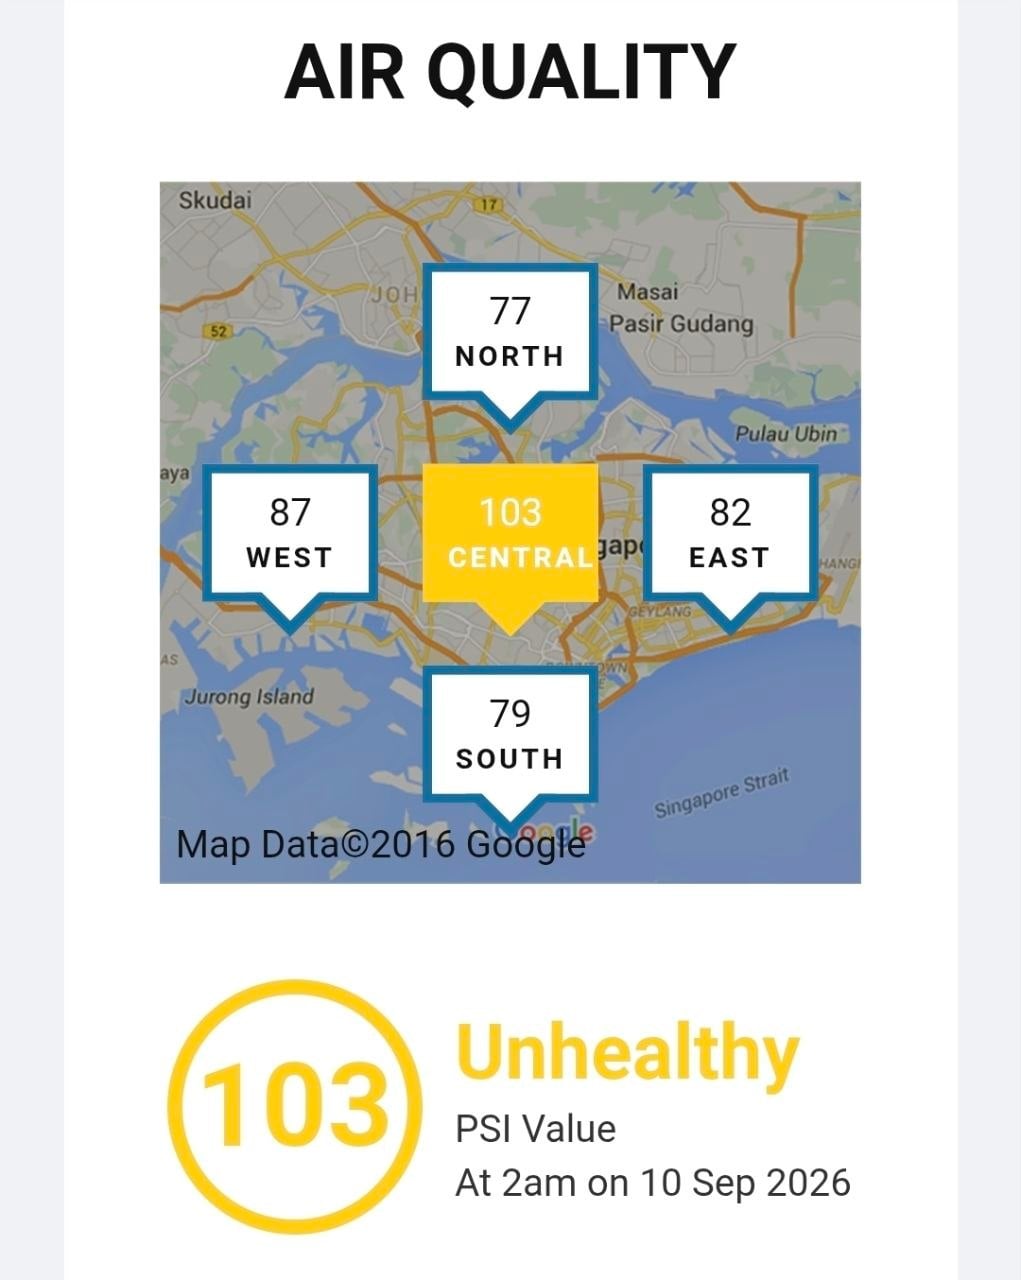
NEA publishes PSI across five regions: North, South, East, West and Central. It's the most granular officially published air quality breakdown for the island.
It is also, for property purposes, almost useless as a comparison tool. These regions are broad quadrants, not URA planning regions or districts. A block in Punggol and a block in Woodlands may both fall under a northern reading. A resident of Bukit Panjang and a resident of Sentosa will never appear in the same table in a way that tells them anything actionable.
If you want to understand where the cleaner air is at street level, you have to build the picture yourself — from wind patterns, point sources, traffic geography and urban form.
The uncomfortable truth: the difference between districts is smaller than the difference between days
Here is the single most important finding for anyone trying to rank Singapore's districts by air quality.
Intra-island variation in Singapore is usually modest. Temporal variation is enormous.
On an ordinary Tuesday with a light breeze, the air in Jurong West and the air in Pasir Ris are broadly comparable, and both are fine. On 25 September 2015, when the 24-hour PSI pushed into the Hazardous band during one of the worst haze episodes on record, essentially the entire island was breathing the same problem. You could have moved from Tuas to Tanjong Rhu and changed your exposure by a fraction of what changed between Tuesday and Wednesday.
That doesn't mean micro-location is irrelevant. It means the ranking most people intuitively want — "Singapore's districts, ordered by air quality" — is the wrong frame. The right frame is a stack of exposures.
At the top of that stack, regional haze affects everyone equally. As you move down, the variation becomes local and personal — and increasingly within your control.
The layers that actually differ between a Tampines flat and a Bukit Batok flat are the middle three: fixed sources, mobile sources, and urban form. Those are the layers worth mapping.
The 2026 outlook: monsoons, haze and what shapes the year
Singapore's air quality calendar is driven overwhelmingly by wind. The island sits at the southern tip of the Malay Peninsula, with the Straits of Malacca to the west and the South China Sea to the east, and it is ventilated by two monsoon regimes that reverse the wind direction twice a year.
The southwest monsoon window — roughly June to October — is when Singapore's air quality risk concentrates. That is the period when dry-season burning in Sumatra and Kalimantan, combined with south-westerly winds, can carry transboundary smoke across the Straits.
What pushes a normal year into a bad one is large-scale climate variability. El Niño events tend to delay the onset of the monsoon rains over Indonesia, extending the dry window during which fires can take hold; the Indian Ocean Dipole plays a similar role on a different timescale. The severe 2015 episode coincided with a strong El Niño. The October 2023 haze episode followed a developing El Niño that had suppressed rainfall across the region.
Two important caveats for anyone trying to plan around 2026:
- Singapore's regional geography gives it a partial buffer. The island's position at the end of the Malacca Strait means that by the time smoke arrives, it has often thinned. The worst episodes are the exception, not the norm.
- Non-haze air quality in Singapore has improved substantially over the last two decades. Close to 95% of the country's electricity now comes from natural gas rather than fuel oil, vehicle emission standards have tightened considerably, and industrial emissions controls under the Environmental Protection and Management Act are strict by regional standards. On a clear day, Singapore's air is genuinely good — better than most comparable large cities in Asia.
The forward-looking changes worth tracking into 2026 and beyond:
- Cleaner-energy vehicle mandate. All new car and taxi registrations in Singapore must be cleaner-energy models from 2025, with the requirement extending across the rest of the vehicle fleet from 2030.
- Port consolidation at Tuas. Container operations are progressively migrating from the southern terminals to Tuas Port, with full build-out extending into the 2040s. The Greater Southern Waterfront is the long-run beneficiary.
- Paya Lebar Air Base relocation. The air base is slated to move to Changi in the 2030s, shifting aviation emissions from the east-central corridor toward the far east.
- Tuas Nexus. The co-located integrated waste management and water reclamation facility represents the newest generation of emission-controlled infrastructure, replacing older, dirtier processes.
Every one of those shifts moves emissions between regions. That is the level at which "which district breathes best" actually becomes a meaningful question.
Which districts breathe best: a region-by-region read
Here's the honest methodology note first. Singapore does not publish a district-level air quality ranking, and where NEA's regional monitoring does show localised differences on ordinary days, they are typically small in absolute terms. What follows is a synthesis of monitoring regions, known point sources, prevailing wind direction and urban form — an informed geographic read, not a measured index.
The West: the heaviest industrial footprint in Singapore
Jurong Island and Tuas together form the densest concentration of heavy industry and combustion sources in the country. Within this area you have petrochemical refining and cracking on Jurong Island, tank farms, the new Tuas Port, Jurong Port's Tuas terminal, power generation, and three of Singapore's waste-to-energy plants — Tuas, Tuas South and the newer TuasOne — plus the Tuas Nexus development.
The wind logic is what makes this region notable. During the southwest monsoon, prevailing winds arrive from the southwest — meaning that for several months a year, the western and north-western residential towns sit downwind of that industrial cluster.
That said, a crucial qualifier: NEA's regional readings have historically tracked fairly closely to the national picture, which tells you that emission controls at these facilities are stringent and the day-to-day signal is smaller than the raw geography would suggest. The exposure is real but it is not dramatic.
- Highest relative local exposure: Tuas, Pioneer, Boon Lay, Jurong West, parts of Bukit Batok and Choa Chu Kang
- Tengah's nuance: marketed heavily as a green "forest town," Tengah sits adjacent to the Bulim industrial area and within the western industrial catchment — a reminder that a town's branding and its airshed are two different things
- Lower relative exposure: Clementi Park, Upper Bukit Timah and the nature-reserve fringe in D21, where elevated terrain and vegetation cover help
The North: Senoko, the Causeway and cross-border air
The north's story is a combination of domestic and transboundary sources. The Senoko industrial estate and power station cluster sits on the north-western shoreline, and Singapore's fourth waste-to-energy plant operates there. Woodlands Industrial Park, Sungei Kadut and Kranji add further industrial footprint inland.
Then there is the traffic dimension. The Causeway is one of the busiest land border crossings in the world, and at peak periods the queues of idling vehicles along Woodlands Centre Road and the surrounding approach roads are a meaningful local source of nitrogen dioxide and particulates.
Under the northeast monsoon, Singapore's northern coast sits downwind of the Johor industrial corridor — including the Pasir Gudang area, which has itself experienced significant local air quality controversies over the years. The Straits of Johor is narrow enough that northern Singapore and southern Johor effectively share an airshed.
- Higher relative exposure: Admiralty and Sembawang blocks close to Senoko; Woodlands blocks adjacent to the Causeway approach and industrial parks
- Lower relative exposure: Springleaf and the Upper Thomson fringe in D26, which sit at the edge of the Central Catchment Nature Reserve, and coastal Sembawang blocks with unobstructed sea ventilation
- Watch-out: Low-floor, road-facing units along the Causeway corridor
The South: the port is leaving, and that changes things
The southern corridor — Telok Blangah, Bukit Merah, Queenstown, HarbourFront and Tanjong Pagar — has historically carried exposure from port and shipping activity. Vessels burning heavy bunker fuel are a significant source of sulphur dioxide and particulates.
Two structural shifts are changing that picture.
First, the IMO sulphur cap: since 2020, vessels have been required to use fuel with a sulphur content of 0.5% or less, down from 3.5%, with tighter limits in emission control areas. That is a substantial reduction in shipping-related SO₂.
Second, the port is moving. Tanjong Pagar Terminal ceased container operations in 2017 and the land is being redeveloped as part of the Greater Southern Waterfront. Pasir Panjang's operations are progressively relocating to Tuas. Over the coming decade, the southern shoreline's largest fixed emission source will simply leave.
The trade-off is construction dust. The Greater Southern Waterfront, the Circle Line and Cross Island Line works, and the broader redevelopment of the southern corridor mean that for the next several years, the south will have more construction-related particulate matter than it did before — while its long-term trajectory improves.
- Higher relative exposure now: HarbourFront and Telok Blangah blocks near the working terminals and cruise centre; arterial road corridors (AYE, CTE, ECP)
- Structurally improving: the entire Greater Southern Waterfront over the 2030s
- Lower relative exposure: elevated pockets of Queenstown and Bukit Merah away from expressways, and Sentosa's eastern and southern-facing coastline
The East: Changi, Loyang and genuinely good coastal ventilation
The east is a study in contrasts. Changi Airport is a major fixed source — aircraft, ground support equipment and the associated road network — and Terminal 5 will substantially expand that footprint over the 2030s, at the same time as Paya Lebar Air Base relocates aviation activity eastward. Loyang industrial estate adds marine, oil and gas fabrication activity on the north-eastern coast.
But the east also has some of Singapore's best natural ventilation. Bedok, Tanah Merah and Pasir Ris sit on an exposed coastline with a reliable sea breeze that disperses local emissions efficiently. Coastal development in these areas tends to be low-rise and low-density, which reduces the street-canyon effect that traps pollutants.
- Higher relative exposure: Changi and Loyang industrial fringe; Tampines blocks adjacent to the PIE and TPE
- Lower relative exposure: Pasir Ris, the Tanah Merah and Bedok coastal fringe, Simei's low-density pockets
- Watch-out: the T5 and Paya Lebar relocation timelines, which will shift aviation emissions eastward within the decade
The Central corridor: traffic dominates, greenery partially offsets
The central region — Bishan, Toa Payoh, Ang Mo Kio, Novena, Newton, Orchard and Bukit Timah — has almost no heavy industry. Its air quality profile is defined by traffic volume and construction.
Bukit Timah Road, Lornie Road, the PIE, the CTE and the network of arterials that thread through these towns carry enormous daily vehicle volumes. The emissions are nitrogen oxides and particulates, concentrated at street level and in the pedestrian environment.
What partially offsets this is greenery. The Central Catchment Nature Reserve, MacRitchie Reservoir, the Botanic Gardens and the mature tree canopy across these towns provide measurable particulate interception and help moderate the urban heat island effect — which in turn reduces the photochemical ozone formation that strong sunlight drives.
Here's the irony worth sitting with: D10 and D11 contain some of the most expensive residential addresses in Singapore, and they sit on top of some of the busiest roads in the country. Price and clean air do not correlate neatly. Whatever premium Bukit Timah commands, it is not being paid for superior air.
- Higher relative exposure: low-floor, road-facing units along Bukit Timah Road, Lornie Road and the expressway corridors
- Lower relative exposure: the nature-reserve fringe of Upper Thomson, the elevated and set-back pockets of Bishan and Marymount, the MacRitchie perimeter
The north-east: Punggol, Sengkang and Serangoon
The north-east — Punggol, Sengkang, Hougang, Serangoon — is largely residential and light-industry, with no major heavy fixed sources. Punggol Northshore is deliberately designed around coastal ventilation and has excellent natural air exchange. Sengkang's western fringe touches Seletar Aerospace Park, which introduces some aviation-adjacent activity, and Punggol Digital District and the wider north-east construction pipeline will generate dust over the medium term.
On balance, the north-east has one of Singapore's better combinations of low fixed-source density and good ventilation — though as with everywhere else, the block-level detail matters more than the town-level label.
The summary read
| Region | Representative areas | Dominant local sources | Relative local exposure |
|---|---|---|---|
| West | Tuas, Pioneer, Boon Lay, Jurong, Bukit Batok, Choa Chu Kang, Tengah (D22, D23, D24) | Petrochemicals, power, port, three waste-to-energy plants | Highest |
| North | Woodlands, Sembawang, Admiralty, Yishun (D25, D27) | Senoko industrial and power cluster, Causeway traffic, cross-border emissions | Moderate to higher |
| South | HarbourFront, Telok Blangah, Bukit Merah, Queenstown (D3, D4) | Port and shipping, dense arterials, construction | Moderate, structurally improving |
| East | Changi, Loyang, Tampines, Bedok, Pasir Ris (D16, D17, D18) | Changi Airport, Loyang industrial, expressways | Moderate, with very good coastal pockets |
| Central | Bishan, Toa Payoh, Ang Mo Kio, Novena, Bukit Timah (D10, D11, D12, D20) | Traffic volume, construction, ozone formation | Moderate to higher at street level |
| North-east | Punggol, Sengkang, Hougang, Serangoon (D19, D28) | Largely residential, light industry, construction | Lower to moderate |
Read that table with one caveat: the column that matters most is the one that isn't there. Block-level orientation, floor level and facade exposure can swing your personal air quality more than moving three towns across.
The premium question: does clean air show up in price?
This is where the analysis gets genuinely interesting — and where an enormous amount of well-meaning speculation gets it wrong.
A large body of international research has found that air quality is capitalised into home prices. Studies across the United States, China and Europe have repeatedly shown that areas with higher particulate concentrations trade at lower values, all else equal. The estimated magnitudes vary enormously between markets, but the direction is consistent.
So does that hold in Singapore?
The honest answer: weakly, indirectly, and mostly through other variables.
Here's why. When people rank the things they'll pay for in a Singapore home, the observable, transaction-tested drivers are:
- Lease tenure and remaining lease — consistently one of the most powerful and measurable price factors in the HDB resale market
- Connectivity — proximity to MRT stations and interchange nodes, with well-documented capitalisation in resale prices
- Supply and age — the pipeline of new BTOs in a town, the age of the block, and the ethnic integration policy constraints on the resale pool
- Floor level, size and layout — high floors command a premium, and so does efficient square footage
- Amenity density — malls, hawker centres, schools, parks
Air quality sits outside that list. Not because it doesn't matter, but because buyers cannot observe it at the point of decision and cannot verify it in a listing. You can look up the nearest MRT station in seconds. You cannot look up the PM2.5 exposure of a specific unit.
That asymmetry produces a predictable outcome.
Where the correlation is real but the causation isn't
The west is Singapore's most affordable residential region and also its most industrial. That sounds like evidence of an air quality discount. It isn't, primarily. The west is cheaper because of distance from the central business district, a higher concentration of older HDB stock, a different supply pipeline, and a labour market anchored to industrial employment rather than office work.
Conversely, D10 and D11 command Singapore's highest PSFs while sitting on its busiest road corridors. If clean air were being priced, those districts would look very different.
Where a genuine clean-air-adjacent premium does appear, it tends to be a greenery premium in disguise. Research on Singapore's market has suggested that homes adjacent to parks and nature areas command a premium, and buyers do value quiet, leafy, low-density environments. But that premium is being paid for amenity, aesthetics and microclimate — with better air as a side effect rather than the headline.
The three places where air quality does move money
-
Expressway-facing units. Blocks directly facing the PIE, AYE, CTE, ECP or a major arterial consistently absorb a discount, driven by noise primarily and dust secondarily. This is the most reliably observable air-quality-adjacent price effect in Singapore.
-
Industrial-adjacent blocks. Flats sitting within a few hundred metres of an industrial estate — Senoko, Loyang, Jurong, Bulim — tend to see softer demand and slower absorption than comparable blocks further away. It's rarely framed as an air quality issue, but it's part of the package.
-
Haze-episode sentiment. After a significant haze event, there is a visible but short-lived uptick in searches and enquiries about air quality, filtration and location. It has not, so far, translated into a durable pricing shift. Attention decays with the wind direction.
The practical upshot: air quality is currently a tiebreaker, not a price driver. If it ever becomes a price driver, the trigger will be either a sustained run of bad haze years or the arrival of genuinely granular, address-level air quality data that buyers can check as easily as a PSF chart.
What you can actually control
The layer of the exposure stack you have the most leverage over is the bottom one. A few practical points worth knowing:
- Check regional readings, but check the hourly PM2.5 instead. The 24-hour PSI is a lagging, smoothed indicator. NEA's one-hour PM2.5 readings on myENV fluctuate far more and are a better guide to whether to open the windows right now.
- Visit at peak hour, not at 11am on a Sunday. Traffic-related pollutants peak during the morning and evening commutes. A viewing at the wrong time of day tells you nothing about the air you'll actually live in.
- Look at what your windows face. A unit facing an internal courtyard or a tree-lined road has a fundamentally different exposure profile from one facing a six-lane arterial — even within the same block.
- Cross-ventilation beats sealing up. Singapore's climate allows genuine natural ventilation for much of the year, and flushing indoor air is the single most effective intervention available to most households.
- Indoor sources often dominate. Formaldehyde from new cabinetry and furniture, VOCs from fresh paint and adhesives, cooking emissions and secondhand smoke typically contribute more to your personal exposure than anything outside. The commonly cited figure is that people spend close to 90% of their time indoors.
- A HEPA purifier genuinely works. Unlike houseplants — which do essentially nothing measurable for indoor air quality at realistic densities — a properly sized HEPA unit measurably reduces indoor PM2.5 during haze episodes.
- Watch incineration-day behaviour. During haze, NEA advises limiting prolonged outdoor exertion when the PSI enters the Unhealthy range, and N95 masks are recommended for outdoor activity in those conditions.
Food for Thought
1. If a 2015-scale haze episode happened next year, would it move prices — or just move search traffic? Attention to air quality spikes hard during an episode and decays fast afterwards. The question is whether repeated episodes eventually cross the threshold from public concern to revealed preference.
2. Would you rather live 200 metres from an MRT station on a six-lane road, or 800 metres away on a quiet street? The market overwhelmingly rewards the first. Your lungs are not the market.
3. As Pasir Panjang's terminals wind down and Tuas absorbs the port, who captures the value of the southern shoreline's improvement? The air quality dividend will be real and long-lasting. Whether it shows up in the price of a Telok Blangah resale flat a decade from now is a genuinely open question.
4. Why do we ask about school distance and not about ventilation design? Cross-ventilation, window orientation and facade exposure are checkable, permanent, and affect every day you live in a home. Almost nobody asks.
5. If address-level air quality data became as easy to compare as PSF, would buyers actually change their behaviour? There's a version of this where clean air becomes a genuine market factor. There's another where people keep optimising for the school and the MRT, and air quality stays what it is today: an invisible line item.
The bottom line
Singapore breathes reasonably well. The country's non-haze air quality has improved substantially over two decades, its industrial controls are strict, and the biggest source of variability in what you personally inhale is not which town you live in — it's which day it is.
That said, geography is not nothing. The west carries the heaviest fixed-source load and sits downwind of it for part of the year. The north shares an airshed with Senoko and Johor. The south is on a long, quiet improvement path as the port relocates. The east has Changi but also some of the island's best sea ventilation. The centre has traffic, greenery and Singapore's most expensive addresses, all on top of each other.
The district you choose will not determine your life expectancy. The block, the floor and the direction your windows face probably matter more. And the layer you control — indoor air — matters most of all.