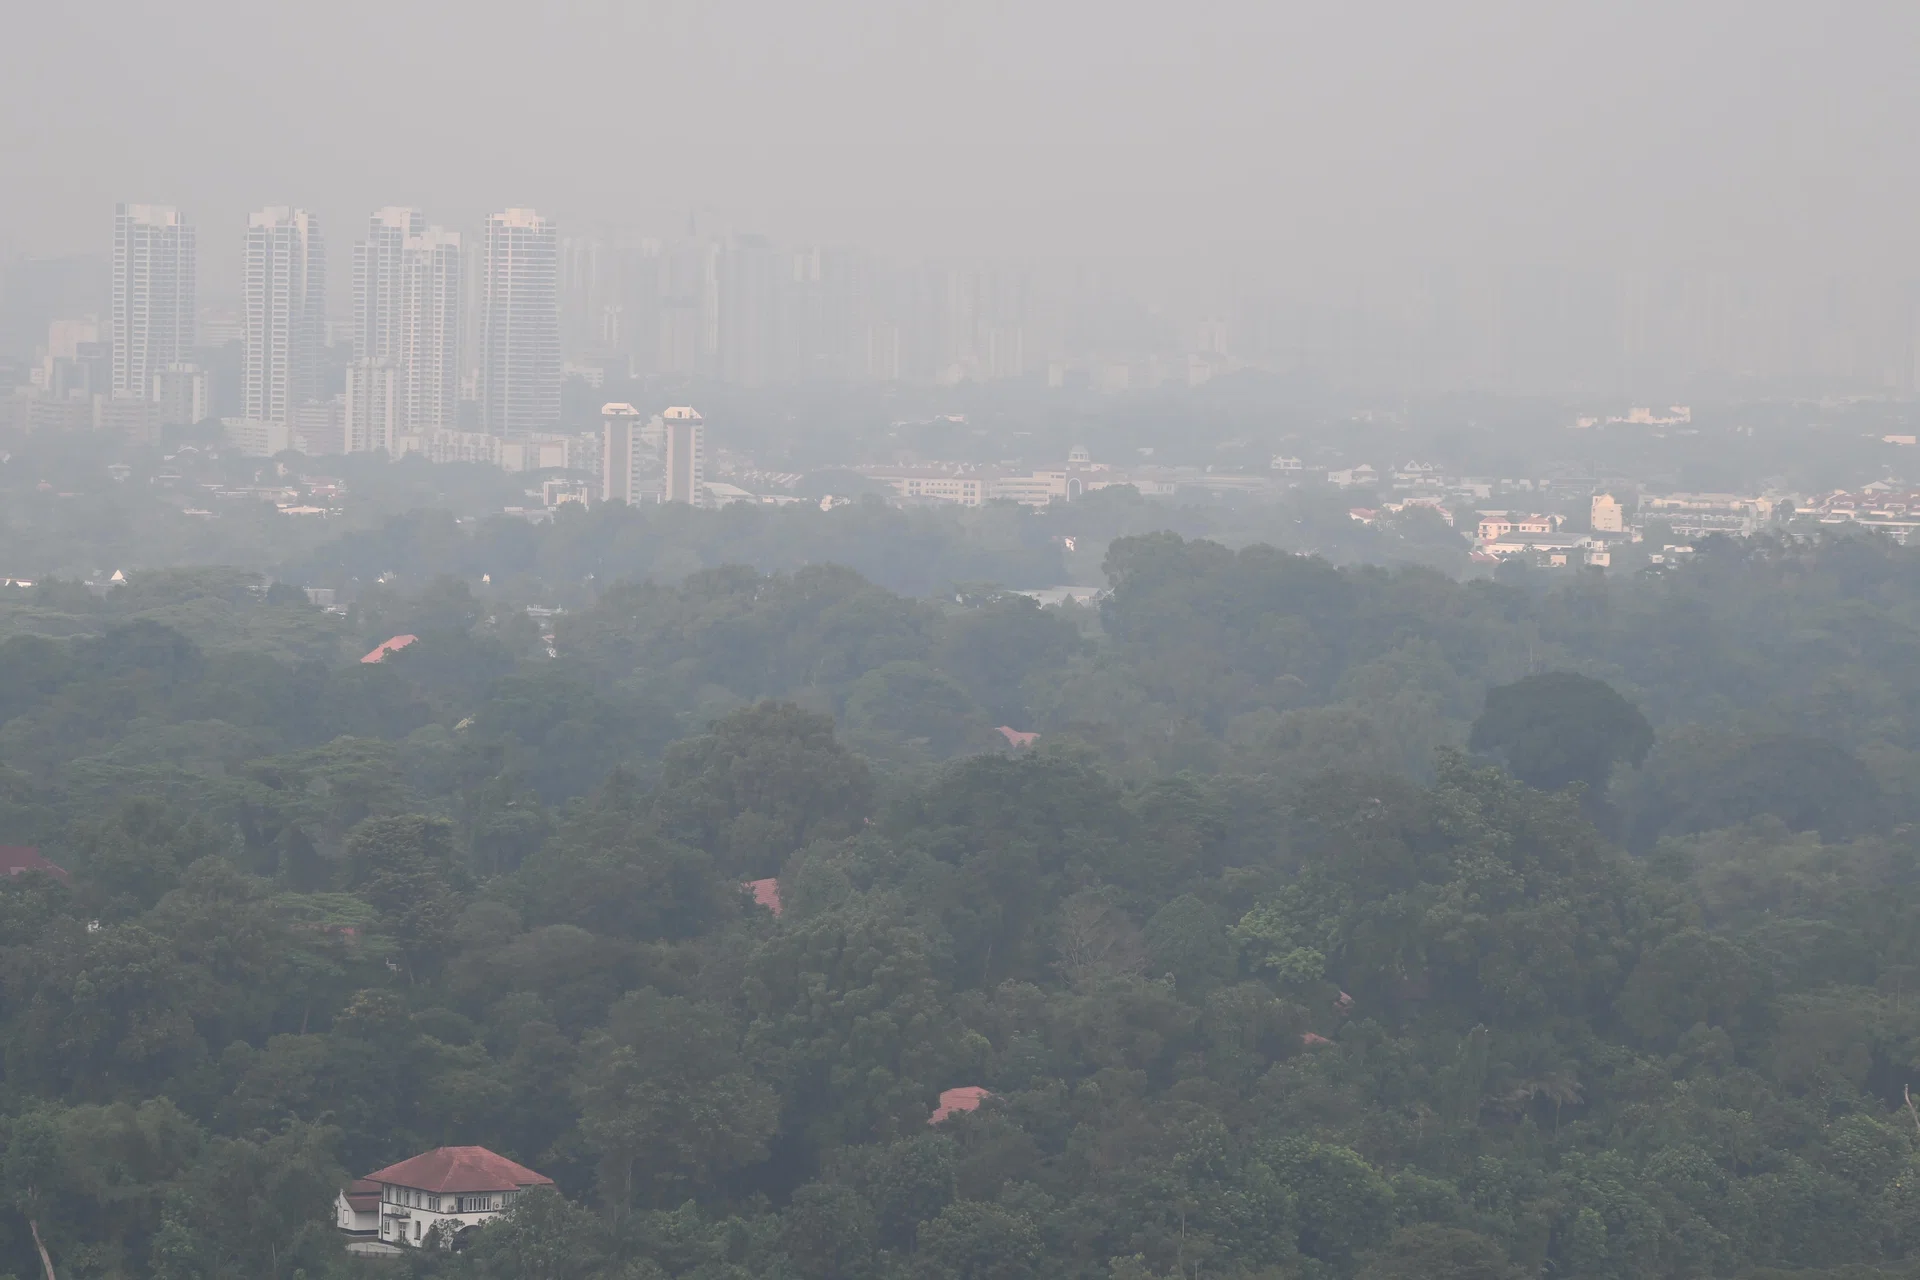
It was the first weekend of October 2023, and the haze was back. PSI readings in the southern part of Singapore had drifted into the unhealthy range, phone screens glowed with air quality advisories, and pharmacists were dusting off their mask displays. Yet inside a condominium showflat in a well-heeled district, the conversation was about MRT distance, layouts, and whether the kitchen counter was real stone. Nobody asked about the PSI. Nobody asked whether the seller's price should be discounted by a few points of hazy air.
That scene raises a genuinely uncomfortable question — one that gets asked in hushed tones at property gatherings but almost never in open-house negotiations: does Singapore air quality affect your home's property value? When the PSI rises, do prices fall? Do "cleaner air" neighbourhoods actually command a premium, or is the haze just background noise in a market driven by much louder forces?
The short answer is surprisingly clear. In Singapore, air quality is rarely a measurable price driver — not because it doesn't matter, but because of how it is measured, how often it misbehaves, and how cheaply it can be mitigated. Let's dig through the data to see why.
The Haze That Forced the Conversation
Singapore's relationship with air quality is defined by two dates seared into national memory:
June 2013. For days, a thick grey blanket from burning forests in Sumatra smothered the island. On the night of 21 June, the 3-hour Pollutant Standards Index (PSI) hit 401 — at that point, the highest reading Singapore had ever recorded. The sky turned an apocalyptic orange, masks sold out within hours, and outdoor events were cancelled across the island.
September 2015. Just over two years later, the record was broken. On 24 September, the 3-hour PSI peaked at 471, driven by peat and forest fires in Sumatra during a strong El Niño year. It was Singapore's worst haze episode on record. Schools were closed the following day, the Government issued work-from-home advisories, and the PSI became part of everyday vocabulary.
Record 3-Hour PSI Peaks During Singapore's Worst Haze Episodes
Both episodes made the same psychological point: air quality can deteriorate fast, and when it does, it affects everyone, regardless of the district you live in.
Note that these headline numbers are 3-hour PSI readings, not the 24-hour averages used for health advisories — and there's an important technical wrinkle. Singapore revised its PSI computation in April 2014 to include fine particulate matter known as PM2.5 — particles small enough to enter the bloodstream. So the 2013 and 2015 peaks aren't strictly apples-to-apples. Even the data itself resists clean comparison, which is a theme that will recur when we try to link it to property prices.
What did the property market do during these haze shocks? Remarkably little.
In 2013, HDB resale prices were near their historic peak, and the market's subsequent cooling was driven by loan curbs and the Total Debt Servicing Ratio (TDSR) framework introduced that same month — not by hazy skies. In 2015, the resale market was already in a multi-year correction from policy tightening. The haze made for grim photographs, but transaction data showed no additional "haze crash" layered on top of the policy-driven slowdown.
Fast forward to recent years, when the market has been far hotter:
HDB Resale Price Growth, 2019-2023 (%)
The chart above is based on HDB's annual Resale Price Index changes. Here's the punchline: 2023 — the year the haze returned in a significant way for the first time since 2019 — HDB resale prices still grew by roughly 4.8%. If hazy air meaningfully discounted property values, you would expect at least a visible wobble in a year when Singaporeans were checking the PSI app again. There wasn't one.
What PSI Actually Measures (and What It Misses)
Before we pronounce air quality irrelevant to property prices, it helps to understand the metric itself.
The Pollutant Standards Index is Singapore's official measure of air quality, administered by the National Environment Agency (NEA). It distills readings of six pollutants — PM2.5, PM10, sulphur dioxide, nitrogen dioxide, ozone, and carbon monoxide — into a single number. The bands are familiar from every haze bulletin:
| PSI Range | Band | What It Means Practically |
|---|---|---|
| 0 – 50 | Good | Normal activities — no precautions needed |
| 51 – 100 | Moderate | Acceptable for most; sensitive individuals should watch for symptoms |
| 101 – 200 | Unhealthy | Reduce prolonged or strenuous outdoor exertion |
| 201 – 300 | Very Unhealthy | Avoid outdoor exertion; stay indoors where possible |
| Above 300 | Hazardous | Minimise outdoor activity entirely; keep windows closed |
What these bands don't tell you is where the haze is worst. NEA publishes PSI readings by five broad regions — North, South, East, West, and Central — based on readings from monitoring stations across the island. That's useful for a general sense of the day, but it is not a neighbourhood-level or district-level dataset.
This creates the first problem for anyone trying to price "clean air" into a home purchase: there is no such thing as a "district PSI" in Singapore's official data. If you're comparing a resale flat in District 15 (East Coast) with one in District 22 (Jurong), you cannot pull up a clean, ten-year historical air quality series for each district and run a tidy correlation. The official data is simply too coarse.
That doesn't mean the readings are useless. It means any credible analysis must be honest about what the PSI can and cannot show — and the same discipline applies to property data. A raw transaction price is also a coarse signal, bundling location, lease, floor level, renovation, and sentiment into one number. Disentangling these factors is exactly the kind of work data analytics platforms exist to make easier.
Why Some Neighbourhoods Breathe Better Than Others
Even without district-level PSI data, Singaporeans know from lived experience that hazy air is not distributed evenly across the island. During the southwest monsoon — the classic haze season from June to October — the south and west of Singapore typically record higher and earlier PSI spikes, because the smoke arrives from fires in Sumatra on prevailing southwesterly winds. Eastern and northern regions often stay relatively clearer for longer, benefiting from wind shifts and sea breezes.
Singapore also has its own local air quality variations that have nothing to do with forest fires:
- Proximity to expressways and major arterial roads — vehicles, especially diesel-powered ones, emit fine particles and nitrogen oxides. Flats facing the PIE, AYE, or CTE can sit in a micro-pocket of poorer air.
- Industrial estates and ports — Jurong, Tuas, Woodlands, Senoko, and parts of Pasir Ris/Tampines host industrial activity that adds to local emissions. This is one reason western Singapore sometimes records elevated readings even in non-haze periods.
- Construction dust — with dozens of BTO projects and condominium developments rising at any given time, nearby residents can experience dusty conditions that the PSI barely captures.
- Urban density and wind flow — tall buildings can block natural ventilation, trapping pollutants at street level, while open coastal areas get the benefit of onshore breezes.
This is why the simple mental map — "east is clean, west is dirty" — is too crude. A high-floor unit in a breezy part of Jurong can experience better air than a low-floor unit directly beside a congested junction in the east.
All of this makes a coherent story for why air quality varies geographically. But here's the crucial next step: variation alone doesn't create a property premium. For that, the variation has to be persistent, measurable, and expensive to fix. In Singapore, haze is episodic, measured coarsely, and cheaply mitigated with an air purifier.
Do Cleaner-Air Neighbourhoods Command a Higher Resale Price?
Let's steelman the "clean air premium" hypothesis. If air quality were a genuine driver of property values, we would expect to see:
- Persistent price discounts in areas that consistently record higher PSI or PM2.5 levels, after controlling for distance to the CBD, MRT access, and other amenities.
- A price reaction following major haze episodes, with haze-prone districts losing value relative to cleaner ones.
- Visible premiums for homes with features that improve air quality, such as good cross-ventilation, high floors, or green building certifications.
What does the actual Singapore market show?
The West is hazier, and it's still thriving. Jurong and its surrounding districts are routinely on the higher end of PSI readings during the southwest monsoon, and they host much of Singapore's industrial base. Yet Jurong East has been one of the most closely watched growth corridors in the country, powered by the Jurong Lake District master plan, new MRT lines, and an injection of new commercial and residential stock. Prices there have climbed vigorously — not despite the air quality narrative, but because air quality simply isn't a dominant variable in how buyers price those homes. What matters is the plan, the transport connectivity, and the pipeline of new supply.
The East is breezier, but for multiple reasons. East Coast properties have long commanded premiums, and sellers will happily mention the sea breeze in listings. But is that breeze priced in as clean air, or as a view, a lifestyle, and coastal living? In transaction data, it's effectively impossible to separate the two. A unit at The Bayshore or in a D15 condo is valuable because it's near the sea, near the city, and near a perceived quality of life — not because its PM2.5 readings are three micrograms lower.
Prime districts (D9, D10) tolerate traffic-heavy air at premium prices. If you could somehow rank Singapore's land by air quality, the Orchard Road and Bukit Timar corridors would not top the list. They're congested, dense, and criss-crossed by major roads. Yet they remain among the most expensive residential real estate in the country. That single observation tells us a great deal: location, status, and proximity to the core economy overpower air quality in almost every price comparison.
And in 2023, the market shrugged at the haze's return. The October 2023 episode was the most significant since 2019, with PSI readings crossing into the unhealthy range and plenty of alarmed headlines. It didn't register as a blip in resale volumes or price trends. Sellers didn't panic, buyers didn't walk away, and transactions continued apace.
HDB Resale Price Growth in Haze-Affected Years (%)
The comparison isn't perfect — these were also years of low interest rates, pent-up demand, and policy shifts. But the absence of any visible haze effect is telling. If a bad haze year coincided with near-5% growth, the clean-air premium thesis needs to explain why air quality isn't showing up in the one place it should: the price people are willing to pay.
What Buyers Actually Price In
To understand why air quality doesn't move the needle, consider what does systematically affect resale prices. Property analysts generally point to a handful of hard variables:
| Factor | Does It Move Prices? | Why |
|---|---|---|
| Distance to MRT station | Yes, significantly | Commute time is measurable, daily, and permanent |
| School proximity | Yes, especially for popular primary schools | A decision that compounds over years |
| Lease decay (HDB vs. private) | Yes, structurally | Remaining lease directly caps loan eligibility and buyer pool |
| Floor level and total floor area | Yes | Light, noise, and usable space |
| Facing and unit orientation | Yes, moderately | West-sun units historically sell at a discount; unblocked views command premiums |
| Proximity to expressway | Yes, as a discount | Chronic noise and particulate exposure that's hard to fix |
| Renovation condition | Yes, at the margin | Buyers pay for convenience, not for your taste |
| Air quality / PSI history | No visible systematic effect | Episodic, coarsely measured, and cheaply mitigated |
Notice something about the factors that do matter: they are chronic, measurable, and difficult or expensive to change. You can't move an MRT station. You can't rebuild a school catchment. You can't undo lease decay. These features are baked into the asset forever, so the market capitalises them into price.
Air quality in Singapore is different. A bad haze episode lasts days or weeks, not years. A $200 to $500 air purifier can turn a bedroom's air from "unhealthy" to "good" within minutes. N95 masks cost a few dollars. For the vast majority of buyers, the rational response to episodic haze is to adapt — not to pay hundreds of thousands more for a marginally less hazy district.
Contrast that with expressway noise. No amount of double-glazing fully eliminates the rumble of traffic at 3am. It is chronic, unmissable, and impossible to fix at reasonable cost. That's why units facing expressways trade at observable discounts in resale transactions — the disamenity persists, and the market capitalises it.
Haze simply doesn't meet that threshold. If the episode lasted six months every year and air purifiers didn't exist, the calculus would change overnight. But with the current frequency and duration of haze events, the rational, data-driven buyer treats PSI the way they treat a thunderstorm: something to watch, not something to price into a million-dollar decision.
The Psychology Gap: What We Say vs. What We Pay
There's another layer to this. Surveys and casual conversation suggest buyers care about air quality — especially younger families with infants or elderly parents living with them. Many Singaporeans say they would prefer a breezy, greener neighbourhood. Yet the same buyers routinely choose a unit based on MRT proximity or school catchment.
This is not hypocrisy. It's the way humans actually make purchase decisions. A property transaction is an overwhelming bundle of trade-offs, and buyers deploy mental shortcuts — real estate agents call them "buying criteria" — to narrow the field. Price, location, lease, and layout almost always rank above environmental factors because they are easier to compare.
Air quality also suffers from a salience problem. PSI is a live, current reading. It tells you about today's air, not the neighbourhood's ten-year average. Unless a haze episode is happening the exact week a buyer is viewing homes, the topic simply doesn't come up. Haze has a powerful recency bias — Singaporeans remember 2015 vividly, but the memory fades by 2017, and by 2019 the market had moved on entirely.
What has shifted since the pandemic is attention to indoor air quality. With more people working from home, ventilation, natural light, cross-breezes, and the ability to run an air purifier without noise complaints have become more salient. That may eventually feed into buyer preferences — but it will express itself as a preference for unit design and layout, not as a district-level premium for "cleaner air."
When Air Quality Could Start Moving Prices
History suggests that property prices are slow to absorb new factors — until a shock forces a repricing. Air quality could become a genuine price variable under any of these scenarios:
- Longer haze seasons driven by climate change. If El Niño events become more severe and peatland fires burn for months rather than weeks, haze transitions from an "episodic nuisance" to a "chronic condition." Chronic conditions get capitalised into prices. Under that world, districts that consistently record lower PSI — many in the east and coastal areas — could genuinely command a structural premium.
- District-level or address-level air data becomes mainstream. Right now, no buyer can pull up a 10-year air quality score for a specific block. If NEA or a property data platform published granular historical air quality data by postal code, the information would enter listing portals, comparison sites, and eventually negotiation rooms. What cannot be measured cannot be priced; what can be measured often is.
- Health sensitivity becomes a larger demographic force. Singapore's population is ageing, and younger buyers are simultaneously more health-conscious than any previous generation. Households with asthmatic children, elderly parents, or chronic respiratory conditions may begin making more deliberate location choices — and where demand concentrates, prices follow.
- Green certification becomes a resale differentiator. In the commercial sector, Green Mark and WELL certifications already influence rent and valuation. If residential buyers begin treating green building features — better filtration, energy recovery ventilators, precinct-level greenery — as comparable to a renovated kitchen, we could see premiums emerge at the building level rather than the district level.
Notice what all four scenarios share: they require air quality to become persistent, measurable, or costly to adapt to. None of those conditions are true today.
A Practical Checklist for Air-Conscious Home Hunters
If you're in the 25-to-40 cohort buying your first home or upgrading — and you genuinely care about air quality — here's a sensible, data-informed approach. It won't necessarily change which district you buy in, but it will help you choose the best unit within your budget:
- Check NEA's historical regional trends. Look at 24-hour PSI readings for the region you're targeting across the southwest monsoon months. If the South or West consistently peaks higher and earlier, factor that into your expectations. NEA's website and the myENV app are solid starting points.
- Map local pollution sources. Open a map and identify expressways, major junctions, industrial clusters, ports, and large construction sites within 500 metres of the block. A "clean district" can contain localised hotspots.
- Study the unit's orientation and floor level. High-floor units generally enjoy better dispersion of traffic pollutants than low-floor units. Units that capture prevailing breezes — often facing the south or southeast — benefit from natural ventilation that flushes out indoor pollutants.
- Visit at different times of day. Air near a busy road is worse during peak traffic hours. A Sunday-morning viewing tells you little about weekday PM2.5 exposure. Go back on a Tuesday evening.
- Test the unit's breathing. Stand by the kitchen window and the main bedroom. Can you feel cross-ventilation? If the layout relies on full aircon, factor the electricity cost and the need for a quality air purifier into your monthly budget.
- Treat air purifiers as a line item. For episodic haze, a good purifier with a HEPA filter costs a fraction of your renovation budget. It's the cheapest insurance you can buy for respiratory peace of mind — far cheaper than stretching your budget for a "breezier" district that may or may not deliver measurably better air.
The goal is not to obsess over PSI. The goal is to avoid discovering — six years into a 99-year lease — that your dream flat sits in a wind pocket that traps every particle of evening rush-hour exhaust.
Food for Thought
As you digest all this, a few questions worth sitting with:
- If NEA started publishing historical air quality data down to the postal-code level tomorrow, how quickly do you think buyers would start using it to negotiate? Would you?
- Imagine two identical flats: one in a district with 350 days of "good" air per year, one with 320 days of "good" air but priced 3% lower. Which is the better investment? What if the difference were 250 good days?
- Singaporeans routinely pay premiums for unblocked views, sea breezes, and morning sun — all of which correlate with air movement and light. Are we already paying for air quality without realising it?
- If the 2023 haze had lasted nine months instead of several weeks, which districts would have become relatively more expensive? Would the east coast suddenly be out of reach?
- When you last visited a property, did you check the PSI that day? If not, what does that tell you about your own true preferences?
The Bottom Line
So, does Singapore air quality affect your home's property value?
Not yet — at least not in any measurable, systematic way. The data you'd need to prove a "clean air premium" doesn't exist at the district level, the haze episodes that drive the PSI conversation are too short and too islandwide to create lasting relative value gaps, and the rational economics of mitigation — a purifier, a mask, an air-conditioned bedroom — overwhelm the asset-pricing effect.
What air quality does affect is comfort, health, and quality of life. And those are real things, even if they don't yet show up cleanly in resale statistics. A high-rise unit with good cross-ventilation in a breezy coastal area is a genuinely nicer place to live during a haze episode. You just shouldn't expect the seller's asking price to acknowledge it.
What the PSI story really reveals is a bigger truth about the Singapore property market: most of what buyers think they're paying for — air, views, prestige, "vibe" — is nearly impossible to isolate from the hard fundamentals of location, lease, and connectivity. The market prices what it can measure, and it discounts what it cannot.
That's precisely why data platforms are becoming indispensable in property decisions. A buyer who can separate the measurable fundamentals from the emotional narrative — who knows what an MRT line is actually worth, how a district scores across the full spectrum of amenities, and whether a price premium is backed by substance or sentiment — has an enormous advantage in a market where the average transaction is measured in hundreds of thousands of dollars.