Remember 21 June 2013? Just before 10pm that night, Singapore's PSI — the Pollutant Standards Index, the city-state's version of an air quality index — hit 401, the highest reading ever recorded since the index was introduced. The sky over Tanjong Pagar turned a sickly orange-grey by mid-afternoon. Schools were told to keep students indoors, N95 masks sold out at pharmacies, and the joke went around that Singapore had become the world's most expensive outdoor smoking lounge.
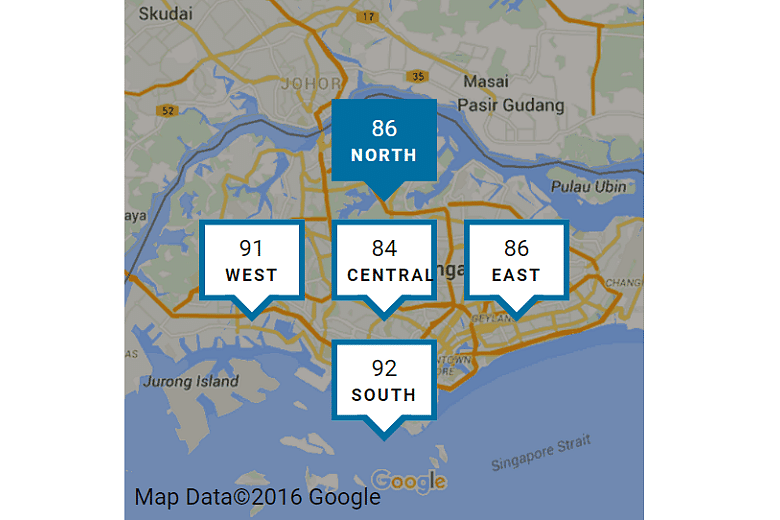
Here is the part fewer people remember: not everyone experienced that haze equally. While the West and South were reporting 24-hour PSI readings deep in the "very unhealthy" range, parts of the East were reading levels that — while still bad — were measurably lower. Air quality in Singapore is not one islandwide number. It is a mosaic that shifts with the monsoon, the wind, and the geography of each neighbourhood.
For property buyers, that raises a genuinely useful question: if you are about to spend hundreds of thousands of dollars on a home you will live in for years, shouldn't "how easy it is to breathe there" be part of the decision?
This article maps Singapore's air quality index across districts — using NEA's public PSI data, monsoon patterns, and the realities of HDB towns and condos — and asks whether haze should change the home you buy.
What Is Singapore's Air Quality Index, and Why Should Buyers Care?
Before we map anything, we need to agree on what we are measuring.
Singapore uses the Pollutant Standards Index (PSI), which is functionally similar to the Air Quality Index (AQI) used in the United States and elsewhere. It combines readings for six pollutants: particulate matter (PM10 and PM2.5), sulphur dioxide, nitrogen dioxide, ozone, and carbon monoxide. The index then produces a single number on a scale that runs from 0 upwards — the higher the number, the dirtier the air.
The pollutant that matters most during haze is PM2.5 — fine particles smaller than 2.5 micrometres, roughly 30 times thinner than a human hair. These particles are small enough to bypass your nose's natural filtration, travel deep into your lungs, and enter your bloodstream. They are also the main ingredient in the smoke haze that blows over from land and forest fires in Indonesia.
NEA classifies PSI readings into five bands, and understanding these bands is essential for any property decision:
| PSI Value | Classification | What it means for daily life |
|---|---|---|
| 0 – 50 | Good | Normal activities. Singapore's default state. |
| 51 – 100 | Moderate | Fine for most people; the elderly and children should avoid prolonged outdoor exertion. |
| 101 – 200 | Unhealthy | Everyone should reduce prolonged outdoor exertion; sensitive groups should avoid it. |
| 201 – 300 | Very Unhealthy | Avoid prolonged outdoor exertion; sensitive groups stay indoors. |
| Above 300 | Hazardous | Avoid outdoor activity altogether; stay indoors and keep windows shut. |
PSI Bands in Singapore (NEA Classifications)
The chart above shows the upper threshold of each band. The jump from "unhealthy" to "very unhealthy" to "hazardous" is not proportional — the health impacts escalate steeply once the PSI passes 200.
Two more data points worth knowing:
- NEA reports PSI for five regions — North, South, East, West and Central — not for individual districts. This means district-level air quality data requires a bit of interpretation (more on that shortly).
- In 2018, NEA scrapped the old 3-hour PSI reading and introduced real-time 1-hour PM2.5 concentration updates, alongside the traditional 24-hour PSI. The 24-hour PSI remains the headline number used to make health-advisory decisions.
Here's the key takeaway for property hunters: the air quality index is measured regionally, but pollution experiences are intensely local. Whether you are on the 3rd floor of a HDB block beside the PIE or the 25th floor of a condo facing the sea can matter more than which "region" your district sits in. We'll unpack both layers — the macro (regional wind patterns) and the micro (building-level design).
A Short History of Haze in Singapore: How Bad Have the Peaks Been?
Haze is not a every-year event for Singapore. For most of the year, PSI readings sit comfortably in the Good band — which is why the haze episodes punch so hard when they arrive. But when they do arrive, they arrive with force.
Here are the episodes that defined modern Singapore's air-quality memory:
| Year | Peak PSI | Source of fires | What it felt like |
|---|---|---|---|
| 1997 | 226 | Sumatra and Kalimantan (Borneo) | Weeks of thick haze; the worst episode at the time; regional economic losses in the billions. |
| 2006 | 128 (reported) | Sumatra | A shorter, milder episode in October that still pushed readings into the Unhealthy band. |
| 2013 | 401 | Riau, Sumatra | The record-breaker. Singapore's PSI entered Hazardous territory for roughly 12 hours on 20–21 June. |
| 2015 | 313 | Sumatra and Kalimantan | A brutal two-week stretch in September–October; multiple consecutive days in the Unhealthy and Very Unhealthy bands. |
| 2019 | 168 | Indonesia (dry season) | A comparatively short but visible episode; the PSI crossed the Unhealthy mark on several days in September. |
| 2023 | Crossed into Unhealthy band | Indonesia, worsened by El Niño | A reminder that haze has not gone away; dry conditions brought back smoky skies in October. |
Peak PSI Readings in Major Haze Years (Singapore)
As the chart shows, the 2013 episode stands alone — it was not a gradual build-up but a sudden, shocking spike. The 2015 episode was arguably worse in a different way: instead of one dramatic peak, it ground on for weeks, with the 24-hour PSI sitting above 100 day after day.
A few historical nuances are worth remembering, because they complicate the simple story of "the West always gets it worst":
- 1997 was different. That year's haze was driven heavily by fires in Kalimantan, which lies to the southeast of Singapore. When the prevailing winds blow from that direction, the East of Singapore can be just as affected as the West. The idea that "eastern districts are always safer" is a myth — it depends entirely on where the fires are burning.
- 2013 and 2015 were Sumatra-driven. Fires in Riau and Jambi sit directly upwind of Singapore during the southwest monsoon, which is why the West and South recorded the highest readings.
- El Niño amplifies everything. Haze years cluster around El Niño events, when the dry season in Indonesia's fire-prone regions becomes dangerously dry. The 1997, 2015, and 2023 episodes all coincided with El Niño conditions.
This history matters for property buyers because a home is a long-duration asset. If you buy a 99-year leasehold flat today, you are committing to live through several more El Niño cycles. Understanding which parts of Singapore are historically more exposed is not paranoia — it is basic due diligence.
Mapping Haze by District: Which Singapore Neighbourhoods Are Most Affected?
Now we get to the maps-and-streets part of the story.
NEA publishes PSI readings for five regions. Singapore's 28 postal districts nest inside these regions reasonably well, so we can build a district-level picture by proxy. The table below shows how the districts map to NEA's monitoring regions, and the characteristic haze pattern each region tends to show.
| NEA Region | Core Districts | Representative HDB Towns & Condo Areas | Typical pattern during a Sumatra-driven haze (SW monsoon, Jun–Oct) |
|---|---|---|---|
| West | D5, D21, D22, D23, D24 | Clementi, Jurong East/West, Bukit Batok, Choa Chu Kang, Bukit Panjang, Tengah, Hillview | First to tip into Unhealthy; highest readings in most episodes. The haze from Sumatra arrives here before anywhere else. |
| South | D3, D4 | Queenstown, Tiong Bahru, Telok Blangah, Bukit Merah, Harbourfront, Sentosa | Consistently among the highest readings; exposed to the winds sweeping up the Straits of Malacca. |
| Central | D1, D2, D6–D12, D14 | CBD, Orchard, River Valley, Novena, Kallang, Toa Payoh, Geylang | Moderate-high readings, plus a local kicker: traffic and the urban heat island add their own PM2.5 on top of the regional haze. |
| North | D20, D25, D26, D27, D28 | Ang Mo Kio, Bishan, Woodlands, Sembawang, Yishun, Seletar | Moderate. Readings lag the West at the start of an episode but catch up as the haze spreads islandwide. |
| East | D13, D15, D16, D17, D18, D19 | Bedok, Tampines, Pasir Ris, Punggol, Hougang, Geylang, Marine Parade | Usually the lowest readings during southwest-monsoon haze — but remember the 1997 exception when Kalimantan fires put the East in the firing line. |
The single biggest driver of these differences is the southwest monsoon, which blows from roughly June to September. Haze from fires in Sumatra — particularly the Riau province, which is almost directly southwest of Singapore — rides these winds across the Strait of Malacca. The West and South of Singapore are the landfall points.
This is why, in the 2015 episode, media coverage repeatedly showed Jurong and the western corridor recording some of the highest PSI readings in the country, while Pasir Ris and Changi reported noticeably lower numbers at the same hour. The gradient was sometimes as wide as 30 to 50 PSI points between the West and the East during the peak of an episode.
Approximate 24-hour PSI by Region at the 2015 Haze Peak
Note: these figures are approximate readings reconstructed from NEA's public reporting and media coverage during the peak of the September 2015 episode; exact readings fluctuated hour to hour. The gradient — West highest, East lowest — is the well-documented pattern.
Three district-level insights emerge from this mapping:
- If you value cleaner air during haze season, eastern and north-eastern districts — Pasir Ris, Tampines, Punggol, Bedok — historically see lower PSI during Sumatra-driven events. That is a genuine lifestyle advantage during an episode.
- Western districts are not "bad", they are just exposed. Jurong, Clementi and Bukit Panjang get the haze earlier and thicker. But they also tend to offer better value per square foot than eastern districts of comparable connectivity, which is exactly the trade-off a buyer has to weigh.
- Central districts hide a local pollution premium. Even when the regional haze is mild, districts around the CBD and major expressways contend with locally generated PM2.5 — diesel buses, idling taxis, construction dust, and the dense canyon of high-rise buildings that traps pollutants at street level. A "Good" PSI reading in the Central region does not necessarily mean the air at ground level along Sims Avenue is as clean as the number suggests.
One more critical caveat before we move indoors: district-level air quality data is simply not published in Singapore. NEA's five-region grid is the official resolution. If you want to get closer to street truth, your best tools are the NEA myENV app for real-time readings, and your own nose during the next haze episode — walk through a neighbourhood you are considering before the fires start, and again when they are burning. The difference is the local data no platform can give you.
HDB vs Condo: How Your Home's Design Affects Indoor Air Quality
Here is where the story gets personal. During the 2013 haze, Singaporeans learned a grim lesson: for most of the episode, outdoor air and indoor air converged. In naturally ventilated HDB flats with windows open — which is how most Singaporeans live when it is hot and hazy — indoor PM2.5 levels can approach outdoor concentrations within hours.
That means the single most important decision about "how clean the air in your home is" is not the PSI number at the nearest NEA station. It is how your specific home handles the air that comes through its windows, doors, and ventilation system.
Let's break this down into the factors you can actually control when choosing a unit.
Floor level: is higher really better?
The classic advice — "buy high, breathe easy" — contains a kernel of truth, but with a critical nuance:
- For traffic-related pollution (vehicle exhaust, road dust), PM2.5 concentrations generally decrease as you go higher. A 12th-floor unit along a major expressway will typically breathe noticeably better than a 3rd-floor unit in the same block.
- However, for regional haze, the picture changes. During a major haze event, PM2.5 is well-mixed throughout the lower atmosphere, and the difference between the 5th and the 25th floor shrinks dramatically. On the worst days, the entire building is in the same soup.
So: higher floors help with day-to-day local air quality, but they are not a haze shield.
Cross-ventilation: a double-edged sword
Singaporean architecture loves cross-ventilation — it is why so many HDB blocks are designed with windows on two sides. It keeps flats cool without air-conditioning and cuts electricity bills. But during a haze episode, cross-ventilation is exactly what you do not want, because it actively pumps smoky air through your living room.
The practical implication for buyers:
- A single-sided unit (windows on one side only) is easier to seal up and filter during an episode.
- A cross-ventilated unit is more comfortable and cheaper to run for 350 days of the year — and harder to protect on the 15 hazy days.
Neither is objectively better; it depends on how much you value normal-day ventilation versus emergency-day sealability.
Air-conditioning: your first line of defence
During haze, the Singapore standard response is: close the windows, crank the air-con, and hope. But air-con units vary enormously in how well they filter:
| Feature | What to look for | Why it matters |
|---|---|---|
| Filter type | Washable pre-filter + fine particle filter (some claim PM2.5 filtration) | Traps a meaningful share of indoor particles during haze. |
| Inverter vs non-inverter | Inverter units maintain indoor air quality more steadily and use less power over long running hours | You will run the air-con for days on end during an episode. |
| Centralised vs split | Centralised systems (in larger condos) can integrate more robust filtration | Some new condos market "fresh air ventilation with PM2.5 filtration" as a wellness feature — ask for the spec sheet and take it seriously. |
| Window vs split | Split units are quieter and more efficient; window units are simpler to replace | Old window units often have poor seals, letting unfiltered air in around the casing. |
The rise of the "wellness condo"
If you have been to a new launch showflat in the last two years, you have heard the buzzwords: biophilic design, circadian lighting, and — increasingly — air purification. Several newer developments market built-in fresh-air ventilation with particulate filters, sometimes as a standard feature rather than an upgrade. This is a genuine evolution in how Singapore residential design responds to haze.
But buyer beware: the marketing and the engineering are not always the same thing. Ask for the specifications — the filter's rating (MERV or HEPA), the air change rate per hour, and whether the filtration runs on a dedicated system or rides on the main air-con. A simple MERV filter on the air-con return air grille is a long way from a true particulate filtration system.
A practical checklist for viewing a home
Whether you are viewing a resale HDB flat or a new launch condo, add these to your viewing checklist:
- Check window sealing. Run your hand along window frames — do you feel drafts? Poorly sealed windows let haze in even when closed.
- Ask about the air-con age and filter type. A 15-year-old system will handle a haze episode far worse than a modern inverter unit.
- Look at the orientation. Units facing west-northwest face the prevailing haze-bearing winds. East-facing units get the morning sun and, during a Sumatra-driven haze, somewhat cleaner air.
- Check proximity to local emission sources. The nearest expressway, industrial estate, or hawker centre matters more for your daily air quality than the regional PSI.
- Budget for mitigation. A good portable HEPA air purifier costs roughly S$150 to S$600, and running costs are modest. Weather-stripping windows costs a few dollars per metre. If you are buying a home in the West, these should be line items in your renovation budget, not afterthoughts.
Should Air Quality Change Which Property You Buy?
Let's be honest: haze is episodic. Singapore's air quality for most of the year is genuinely good, and the annual average PM2.5 concentration in Singapore is far below what residents of Bangkok, Jakarta, or Beijing contend with. If haze were the only factor in a property decision, almost every home in Singapore would be acceptable.
But "almost every home" is not the same as "every home". For specific households, air quality should move from a footnote to a genuine criterion.
When haze should matter more
- You have young children. Kids breathe faster, their lungs are still developing, and health advisories during haze episodes single them out as a sensitive group. A home in a district that historically reads 30–50 PSI points lower during an episode is a real, quantifiable advantage.
- A household member has asthma, respiratory disease, or cardiovascular conditions. This is not a lifestyle preference; it is a medical consideration.
- You work from home. If you spend 12+ hours a day in your residence, indoor air quality matters far more than for someone who commutes to a sealed office tower.
- You are buying long-term. A 99-year lease means you will live through multiple El Niño cycles. Climate projections suggest hotter, drier conditions in the region — which is precisely the recipe for more severe haze years. The "episodic" annoyance of today could become a recurring seasonal reality over your lease horizon.
When haze should matter less
- If your budget is tight. The price gap between a western district and a comparable eastern district can be substantial. An air purifier costs less than one month of mortgage on that difference.
- If you value connectivity over clean air. Living in Jurong East next to an MRT interchange may save you an hour a day — an hour that is worth more than 15 hazy days a year in most people's books.
- If you spend most of your time outdoors elsewhere. Hikers, runners, and dog owners are the exception — they will feel every hazy day. For everyone else, the impact is mostly psychological and indoor.
Here is the honest analytical framing: air quality is a tiebreaker, not a market-driver. To date, there is little evidence that perennial haze exposure has a significant long-term effect on property prices in Singapore's western districts, because the underlying drivers — MRT connectivity, school catchment, lease decay, and proximity to amenities — swamp episodic air-quality differences. If you find two comparable homes at comparable prices, choose the one with better historical air quality. Do not pay a large premium for it, and do not reject a great home in the West solely because of haze.
What to actually do with this information
- Check the NEA PSI history for the region your shortlisted districts fall in. NEA's public data goes back years, and the myENV app lets you see current readings.
- Visit the unit during a haze episode if you can. The smell, the visibility, and the feel of the indoor air will tell you more than any chart.
- Build mitigation into your budget. Air purifiers, window sealing, and a modern air-con system are affordable, effective, and transferable. You can make virtually any home roughly haze-proof for under S$1,000.
- Use a property data platform to anchor the other 95% of the decision. Once you have shortlisted districts that balance air quality with your lifestyle, compare per-project pricing, district trends, and value — the factors that will actually determine whether your purchase is a good one.
Food for Thought
Here are a few questions worth sitting with before you make your next property decision:
- Would you pay a small premium for a district that historically reads 30–40 PSI points lower during haze episodes? Where is that line for you — 1% of the price? 3%? Or is clean air simply non-negotiable?
- As El Niño cycles intensify and haze becomes more predictable, will developers start marketing "haze-proof homes" as a standard feature? And if they do, will older resale units in exposed districts lose value relative to newer, filtered stock?
- Does your home's air quality matter more than its walkability to an MRT station during a haze month? Be honest about which one you would sacrifice first.
- How much of your haze anxiety is actually about the air, and how much is about feeling trapped indoors? If the latter, a home with better windows and a better view may solve more of the problem than a different district ever will.
The Bottom Line
Haze is back in Singapore's conversation, and it is not going away. The honest summary: the West and South get hit first and hardest during Sumatra-driven episodes; the East tends to breathe easier — with the 1997 caveat that no district is permanently immune; and your home's indoor environment matters more than the regional PSI reading. Mitigation for a few hundred dollars can make almost any home liveable through all but the worst episodes.
The bigger lesson is that property decisions are never about one factor. Air quality is a data point — an increasingly relevant one — but it sits alongside connectivity, pricing, lease, layout, and market momentum. The right way to buy is to layer all of these signals together.