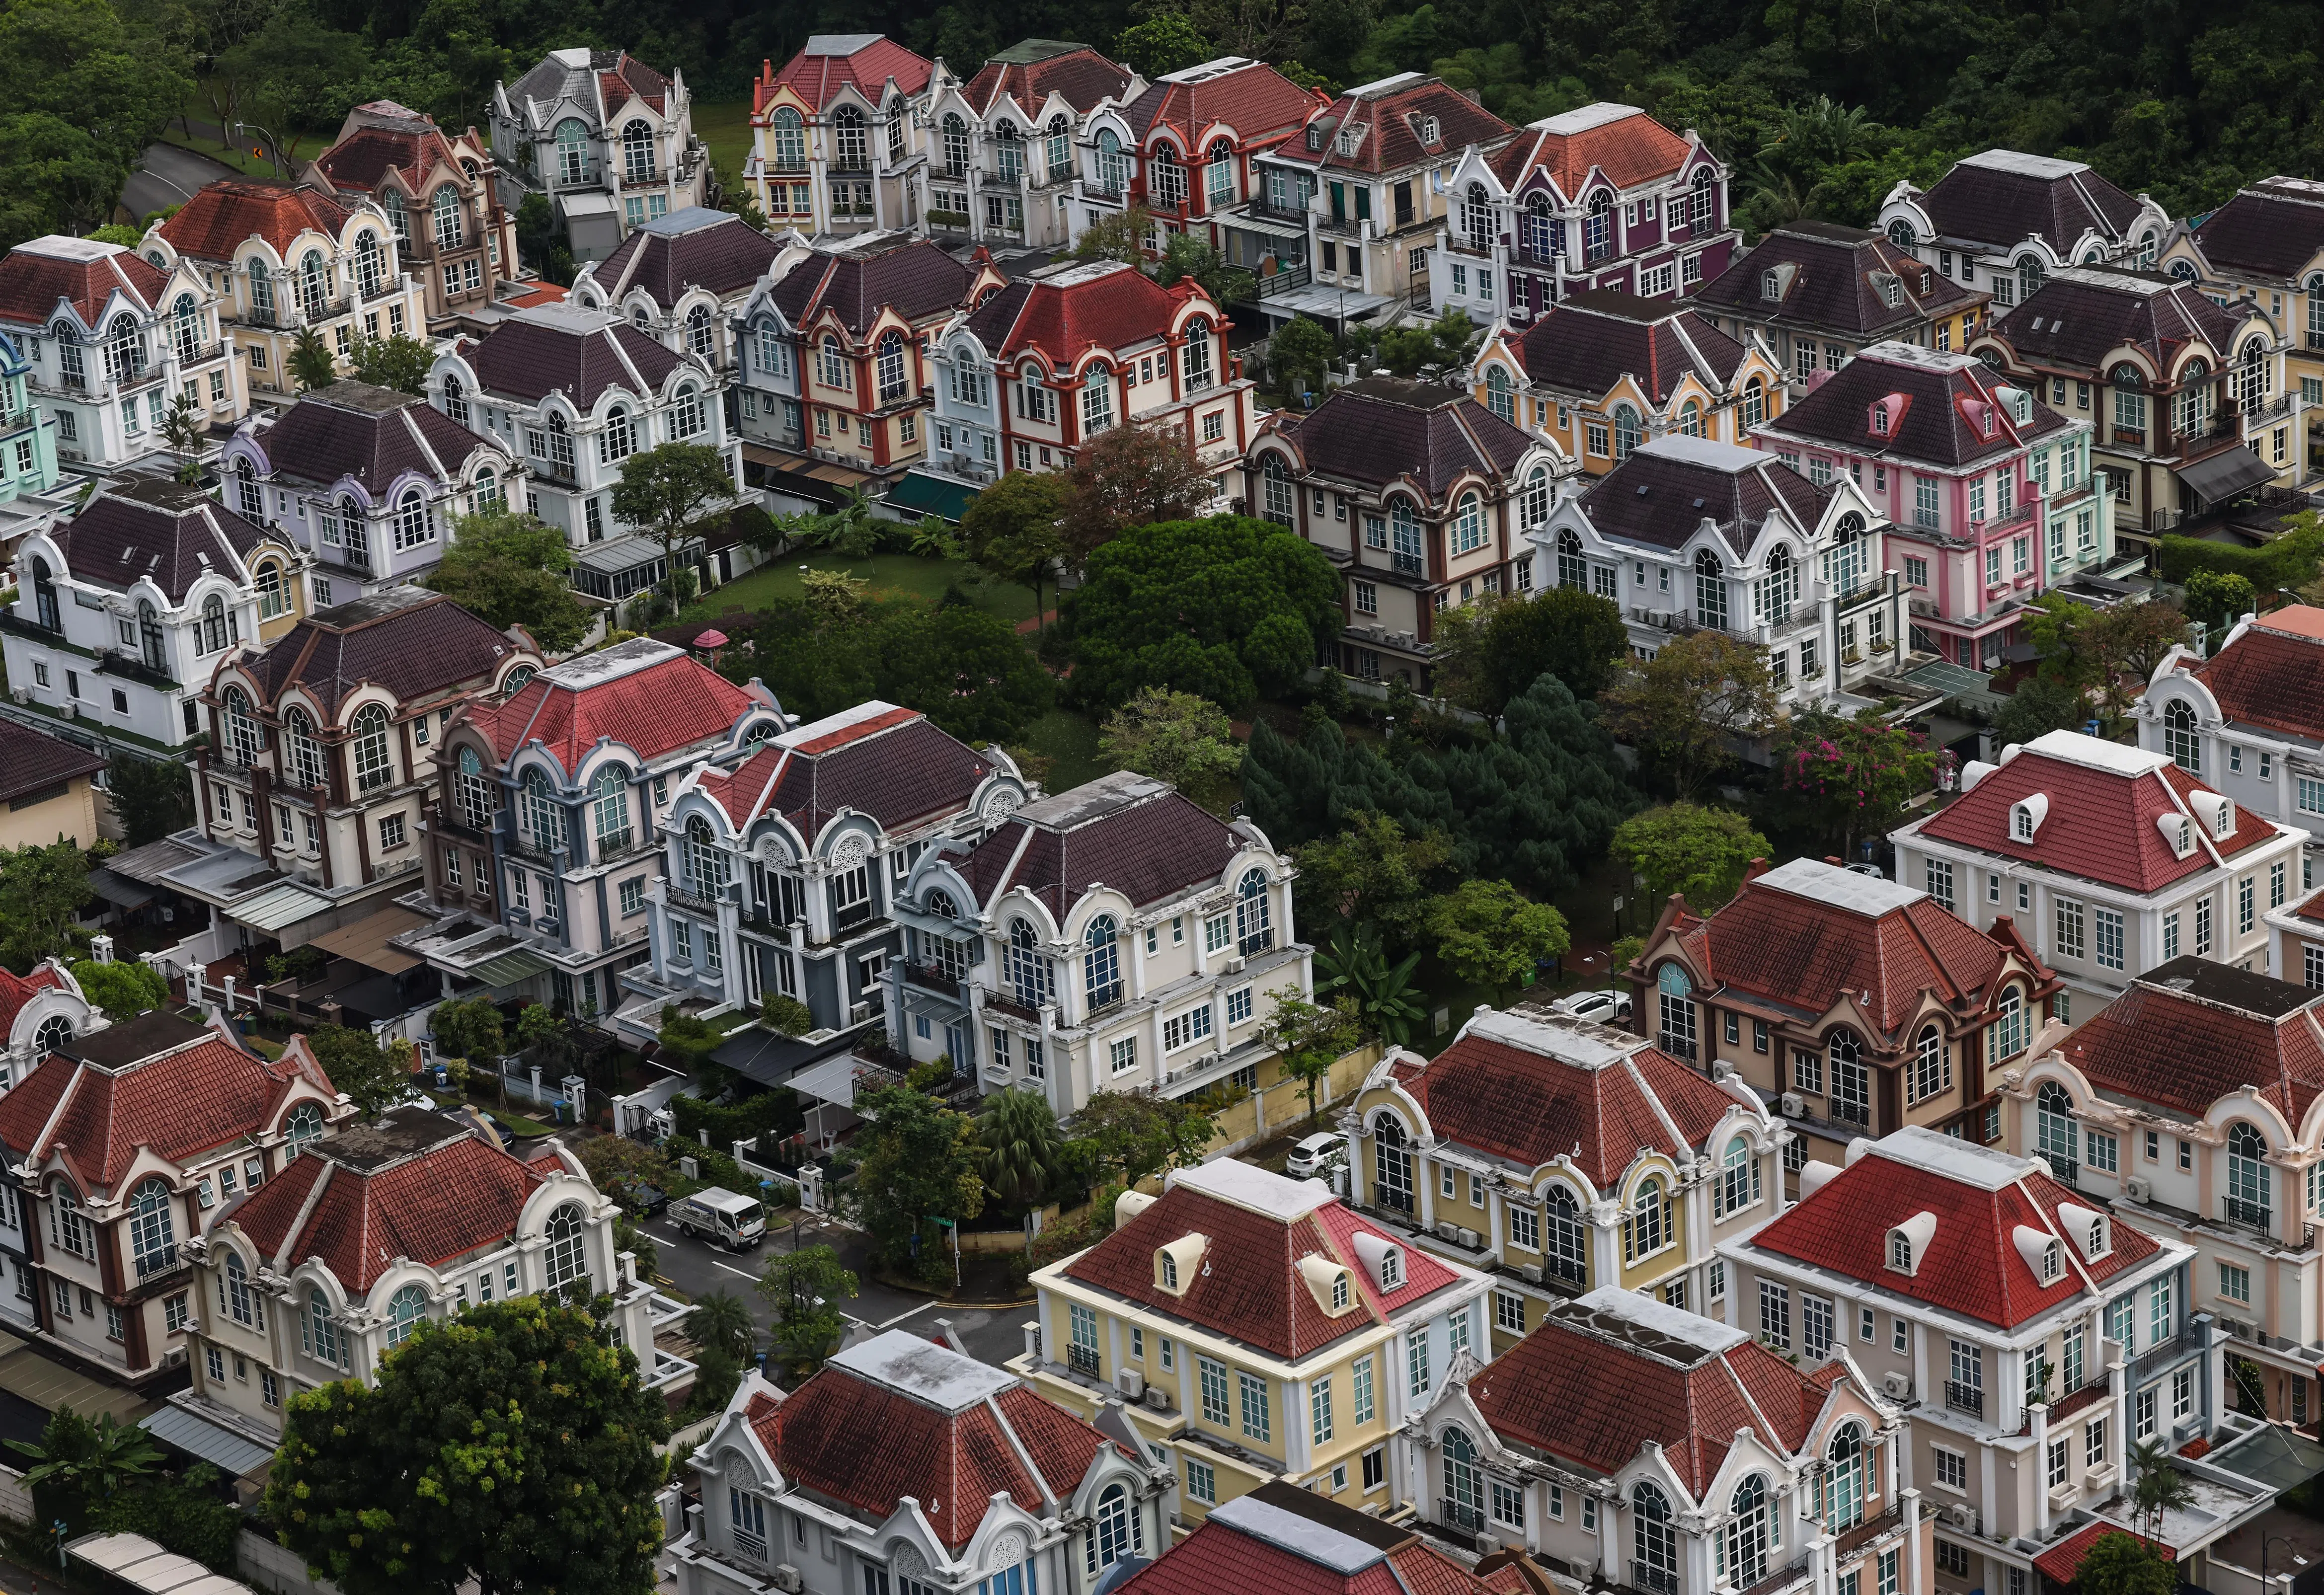
Singapore recorded 216 mortgagee-sale auction listings in the first half of 2026, the highest half-year tally since H2 2019. At first glance, that sounds like a warning that homeowners are defaulting and banks are rushing to foreclose. The reality is more measured: mortgagee listings are rising, but they are not the same as completed sales, unique distressed properties or system-wide mortgage defaults.
The increase deserves attention because it points to genuine financial strain in selected corners of the market—particularly strata industrial properties and some private homes. Yet mainstream housing transactions remain active, private residential prices and rents have continued to rise, and available household credit indicators remain broadly resilient.
The clearest interpretation is therefore neither “nothing to worry about” nor “a housing crisis has begun”. Singapore is seeing more concentrated borrower and asset-level stress, without compelling evidence of broad housing distress.
What the 216 Mortgagee Listings Actually Represent
According to The Business Times, auction specialist ETC recorded 216 mortgagee-sale listings in H1 2026. That was:
- 28.6% higher than the 168 listings in H1 2025
- 30.9% higher than the 165 listings in H2 2025
- The highest half-year figure since the 321 listings in H2 2019
Mortgagee listings also accounted for 74.0% of all auction listings during the period. Owner-sale listings, by contrast, declined considerably.
| Auction listing category | H1 2025 | H2 2025 | H1 2026 | Half-on-half change | Year-on-year change |
|---|---|---|---|---|---|
| Mortgagee sales | 168 | 165 | 216 | +30.9% | +28.6% |
| Owner sales | 86 | 67 | 53 | -20.9% | -38.4% |
| Other sales | 15 | 28 | 23 | -17.9% | +53.3% |
| Total | 269 | 260 | 292 | +12.3% | +8.6% |
Singapore Auction Listings by Category
The change is substantial, but interpreting it properly requires separating four different concepts.
A listing is not necessarily a unique property
An auction listing records an attempt to market an asset. If a property fails to attract a bid at one auction, it may appear again at a later auction with the same or a revised reserve price. Each appearance can be recorded as another listing.
Knight Frank has expressly stated in its historical auction reports that its figures include repeat listings. Its 2019 auction research, for example, found that penthouses offered as mortgagee sales went through an average of 2.6 auction rounds.
ETC’s publicly reported H1 2026 figures were not accompanied by a deduplication methodology. The prudent description is therefore 216 mortgagee listing appearances, not necessarily 216 unique properties.
A mortgagee listing is not necessarily a household foreclosure
A mortgagee sale is initiated by a lender or another secured creditor after enforcement rights have arisen. However, the property concerned might be:
- An owner-occupied private home
- An investment apartment
- A strata retail unit
- An industrial factory owned by a company
- An office or shophouse securing business debt
- A property already marketed in an earlier auction round
This matters because a factory listed after a company experiences cash-flow problems does not provide the same signal about household housing stress as an owner-occupied apartment entering enforcement.
A listing is not a completed sale
The presence of a property in an auction catalogue does not mean it has been sold. It might be withdrawn, relisted, repriced or negotiated privately after the auction.
A completed auction sale requires an acceptable bid and an executed transaction. Public auction statistics generally exclude subsequent private-treaty deals, even when negotiations began because of the auction campaign.
Mortgage arrears are a separate loan-level measure
A borrower may miss payments but resolve the arrears before enforcement. Conversely, a property may reach a mortgagee sale only after months of negotiation, restructuring attempts and unsuccessful open-market marketing.
The relationship is a sequence, not an identity:
The 216 figure sits near the later part of this process. It cannot tell us how many mortgages are currently delinquent across Singapore, how many borrowers recovered before enforcement or how many listed assets eventually changed hands.
Where the Mortgagee Listings Are Concentrated
ETC disclosed the composition of all 292 auction listings, rather than a detailed breakdown of only its 216 mortgagee listings. Residential properties were the largest group, but industrial and retail assets together made up a significant share.
| Property type | All ETC auction listings in H1 2026 | Share |
|---|---|---|
| Residential | 144 | 49.3% |
| Industrial | 87 | 29.8% |
| Retail | 46 | 15.8% |
| Offices, shophouses and others | 15 | 5.1% |
| Total | 292 | 100% |
Industrial listings rose from 58 in H2 2025 and 61 in H1 2025 to 87 in H1 2026. ETC attributed much of that increase to strata-titled Business 1 and Business 2 factories with fewer than 30 years remaining on their leases.
A separate Knight Frank series gives a more specific property-type breakdown for mortgagee listings. It recorded 212 listings in H1 2026—103 in Q1 and 109 in Q2.
| Mortgagee property type | Q1 2026 | Q2 2026 | H1 total | H1 share |
|---|---|---|---|---|
| Residential | 45 | 53 | 98 | 46.2% |
| Industrial | 37 | 42 | 79 | 37.3% |
| Retail | 17 | 8 | 25 | 11.8% |
| Office | 2 | 6 | 8 | 3.8% |
| Shophouse | 2 | 0 | 2 | 0.9% |
| Total | 103 | 109 | 212 | 100% |
Knight Frank Mortgagee Listings by Property Type, H1 2026
The Knight Frank total should not be treated as an exact decomposition of ETC’s 216. The two agencies may differ in timing, coverage and classification. What both datasets show, however, is that the increase is not solely a residential story.
Why industrial properties stand out
Strata industrial assets can become difficult to finance and sell as their leases shorten. A unit with fewer than 30 years remaining may face several overlapping problems:
- Banks may offer a shorter loan tenure or lower loan-to-value ratio.
- The buyer must fund a larger portion of the purchase in cash or equity.
- A shorter remaining lease reduces the pool of future buyers.
- Older premises may require expensive refurbishment.
- Permitted-use and subletting rules can limit occupier demand.
- Lease decay can place persistent pressure on residual value.
These pressures can become self-reinforcing. A smaller buyer pool weakens price discovery, weaker valuations reduce financing availability, and constrained financing further shrinks the buyer pool.
An industrial mortgagee listing may therefore signal structural obsolescence as much as temporary borrower distress. Even if the borrower’s immediate financial problem is resolved, the asset itself may remain difficult to refinance.
What the residential portion tells us
Residential property was still Knight Frank’s largest category, with 98 mortgagee listing appearances in H1 2026. That is meaningful: private homeowners and residential investors are not immune to job loss, business failure, divorce, illness or refinancing pressure.
Still, those 98 appearances should not be read as 98 owner-occupier households losing their homes. Public data do not reveal:
- How many were unique residential units
- How many were repeat auction rounds
- How many were investment properties
- How many were owned through companies
- How many were occupied by their owners
- How many eventually sold privately rather than at auction
The rise is a useful stress indicator, but it is not a household default count.
More Listings, but Few Completed Auction Sales
ETC reported 292 total auction listing appearances and only 13 successfully auctioned properties in H1 2026. The completed sales were worth a combined S$27.67 million, according to EdgeProp.
Reported transactions included:
| Property | Reported auction price | Additional context |
|---|---|---|
| Terrace house at Carisbrooke Grove | S$5.20 million | Residential landed property |
| Terrace house at Lorong 22 Geylang | S$3.50 million | About S$2,112 psf of land |
| Three-bedroom unit at Park Infinia at Wee Nam | S$3.42 million | Private apartment |
| Factory at Paya Ubi Industrial Park | S$1.85 million | Industrial property |
It may be tempting to divide 13 by 292 and call the resulting 4.45% a clearance rate. That would be misleading for two reasons.
First, the 292 listing appearances may contain properties marketed more than once. The denominator is therefore not necessarily a count of unique assets.
Second, the 13 successful properties cover all auction-sale categories. They are not identified as 13 mortgagee sales. Some were owner, sheriff, bailiff or management-corporation sales, and transactions concluded later by private treaty are excluded.
Knight Frank’s Q1 figures provide a little more detail: five properties were knocked down at auction, including three mortgagee sales. Nine properties sold at auction in Q2, but four were identified as two management-corporation sales, one bailiff sale and one sheriff sale. Published information does not establish how many of the other five were mortgagee transactions.
A reliable H1 mortgagee-sale conversion rate therefore cannot be calculated from the public figures.
Why do so many auction listings fail to sell?
A mortgagee sale does not guarantee a bargain. The lender still has a duty to seek a defensible price, while prospective buyers expect compensation for legal, physical and financing risks.
This often creates a gap between:
- The lender’s reserve price
- The property’s formal valuation
- The owner’s historical purchase price
- Comparable recent transactions
- The buyer’s assessment of risk
- The price a bank is willing to finance
In a true liquidation cycle, creditors might accept steep reductions quickly and buyers might clear inventory at distressed prices. H1 2026 instead shows many marketing attempts and relatively few auction-room completions. That suggests price expectations remain apart and creditors are not liquidating indiscriminately.
Some assets will eventually transact after reserve prices are revised. Others may sell through private negotiations, where buyers can conduct more due diligence or negotiate conditions that are difficult to accommodate in a public auction.
The auction count is therefore best understood as evidence of increased enforcement and marketing activity, not proof that hundreds of properties have already been dumped into the market.
Mortgagee Listings Are Rising Even as Interest Rates Fall
The most obvious explanation for financial stress is the earlier surge in borrowing costs. But the timing makes a simple “rates rose, therefore defaults rose” story incomplete.
Three-month SORA was approximately 3.59% in Q3 2024. It fell to 1.72% by Q3 2025, with the Monetary Authority of Singapore describing domestic financial conditions as mildly accommodative, as reported by CNA. By 24 July 2026, the three-month compounded SORA was approximately 1.16%, based on MAS domestic interest-rate data mirrored by StraitsData.
Meanwhile, the HDB concessionary interest rate remained 2.6% in Q2 2026.
Selected Three-Month SORA Observations
Benchmark rates have therefore fallen substantially, while mortgagee listings have risen. This apparent contradiction has several plausible explanations.
Enforcement operates with a lag
A lender generally does not list a property immediately after one late payment. The borrower may be offered restructuring, asked to make partial repayments or given time to sell voluntarily. Legal enforcement and auction preparation also take time.
A property listed in H1 2026 may therefore reflect financial trouble that began in 2024 or 2025.
Fixed-rate packages expire at different times
Borrowers who secured cheap fixed-rate mortgages before or during the early stages of the rate-hiking cycle did not all reprice simultaneously. Some encountered much higher instalments only when their fixed periods ended in 2023, 2024 or 2025.
Even after rates fall, the borrower may have depleted savings or accumulated other debts during the expensive period. Financial recovery is not instantaneous.
The earlier payment shock was large
For illustration, a S$1 million, 25-year amortising loan costs around S$4,000 a month at 1.5%, compared with approximately S$5,278 at 4%. That is roughly 32% more per month.
| Illustrative loan | Interest rate | Approximate monthly payment |
|---|---|---|
| S$1 million over 25 years | 1.5% | S$4,000 |
| S$1 million over 25 years | 4.0% | S$5,278 |
| Difference | — | S$1,278 more per month |
A household or small business exposed to the higher payment for two years could face tens of thousands of dollars in additional cash outflow. Lower rates help, but they do not automatically restore depleted reserves.
SORA is only part of the financing equation
The benchmark rate does not determine credit availability on its own. A borrower’s ability to refinance can also depend on:
- The bank’s lending margin
- Income and Total Debt Servicing Ratio tests
- Employment or business stability
- Current property valuation
- Remaining lease
- Vacancy and rental income
- The borrower’s credit record
- The availability of guarantors or additional collateral
An older industrial unit may remain unfinanceable on acceptable terms even when SORA falls. Similarly, a residential investor who has lost rental income or employment may still struggle despite lower headline rates.
Commercial stress is different from housing stress
The high industrial share is especially important here. A company may default because customer demand weakened, working-capital needs rose or the business ceased operations. The loan might be secured against a factory unit, but the root problem is business cash flow rather than household mortgage affordability.
Falling residential mortgage rates cannot solve an obsolete factory’s short lease or a retailer’s weak occupier demand. The rise in listings is thus partly a story about asset quality and commercial refinancing—not just housing instalments.
Does the Mainstream Housing Market Look Distressed?
If Singapore were entering a broad forced-selling cycle, the signs would usually spread beyond auction catalogues. One might expect falling prices, shrinking transaction volumes, rapidly rising vacancy, weakening rents and widespread credit deterioration.
That is not what the aggregate H1 2026 data show.
Private residential prices and volumes remained firm
Official URA figures show that private residential prices rose 0.9% in Q1 and 0.5% in Q2, producing 1.4% growth in H1 2026.
Private rents also increased, rising 0.3% in Q1 and 0.7% in Q2.
| Private residential indicator | Q1 2026 | Q2 2026 | H1 2026 |
|---|---|---|---|
| Price change | +0.9% | +0.5% | +1.4% |
| Rent change | +0.3% | +0.7% | Continued growth |
| New homes sold, excluding ECs | 2,013 | 2,141 | 4,154 |
| Resale transactions | 3,225 | 3,813 | 7,038 |
| Subsales | 175 | 194 | 369 |
| Total transactions, excluding ECs | 5,413 | 6,148 | 11,561 |
Q2 private resale volume rose 18.2% quarter on quarter. This does not resemble a market in which buyers have broadly withdrawn or owners can sell only through creditor enforcement.
The submarkets were uneven:
- Landed-home prices rose 2.5% in Q2 after declining 0.4% in Q1.
- Non-landed prices slipped 0.1%.
- Core Central Region non-landed prices rose 1.8%.
- Rest of Central Region prices declined 1.2%.
- Outside Central Region prices declined 0.1%.
This variation matters. Aggregate resilience can coexist with project-level weakness. Owners who bought at a high price, used substantial leverage or own less desirable units may experience stress even when the national index rises.
ERA’s indicative transaction medians provide additional context:
| Transaction or launch segment | Indicative median price |
|---|---|
| Non-landed resale | S$1,792 psf |
| Subsale | S$2,430 psf |
| Hudson Place launch | S$2,465 psf |
| Tengah Garden Residences launch | S$2,113 psf |
| Vela Bay launch | S$2,862 psf |
According to ERA, the non-landed resale median rose 1.5% quarter on quarter, while the subsale median increased 4.6%. These figures are sensitive to the mix of properties transacted and should not be treated as repeat-sales indices. Nevertheless, they do not indicate widespread distressed pricing.
Supply conditions deserve monitoring. URA reported 42,472 private residential units in the development pipeline, including 15,810 unsold units with planning approval. Around 60,600 units are expected to be completed over the coming years, while the vacancy rate edged up from 6.2% to 6.4% in Q2.
A larger pipeline could moderate future price and rental growth. It may also widen the gap between newer projects and older stock, particularly developments with weaker layouts, locations or lease profiles. That is more likely to produce selective stress than a uniform market decline.
HDB resale prices softened, but transactions continued
The public housing market was less buoyant. HDB resale prices declined for a second consecutive quarter—the first such pair of quarterly declines since 2019.
| HDB resale indicator | Q1 2026 | Q2 2026 | H1 2026 |
|---|---|---|---|
| Resale Price Index change | -0.1% | -0.3% | About -0.4% |
| Resale transactions | 6,285 | 6,396 | 12,681 |
| Year-on-year volume change | — | -9.9% | -7.4% |
According to ERA’s HDB quarterly analysis, prices were approximately unchanged year on year rather than collapsing. Q2 still recorded 6,396 resale transactions, including 491 million-dollar deals. Those higher-value transactions represented 7.7% of resale volume.
Combined, Singapore recorded 24,242 completed HDB resale and private residential transactions excluding executive condominiums in H1 2026. Knight Frank recorded 98 residential mortgagee listing appearances over the same period.
These measures are not directly comparable: one counts completed transactions, while the other counts listing appearances that may include repeats. Even so, the scale difference is informative. Residential mortgagee auctions remain small relative to normal housing turnover.
Household Arrears Indicators Remain Broadly Resilient
Auction listings can reveal where creditors are taking action, but household credit data are more relevant when assessing systemic housing stress.
The available indicators do not point to a broad deterioration.
Mortgage delinquency remains low
Credit Bureau Singapore data cited by The Straits Times showed a 0.14% home-loan delinquency rate among homeowners aged 21 to 29, based on payments more than 30 days overdue.
That equates to roughly 14 delinquent borrowers per 10,000 in the cohort. It covers only a specific age group and should not be treated as the delinquency rate for every homeowner, but it offers little support for the idea of widespread mortgage failure among younger owners.
Household balance sheets retain substantial buffers
Singapore household net worth reached approximately S$3.3 trillion in Q1 2026. Household liabilities were around S$415 billion, equivalent to roughly 11% of assets.
Household debt stood at 107.9% of personal disposable income, below its ten-year average of about 132%. Mortgage borrowing grew 5.8% year on year, but much of household debt remained backed by property assets.
The International Monetary Fund reported that liquid household assets exceeded total household debt and that bank mortgage non-performing loans remained below their historical average.
MAS stress testing cited by the IMF found that, under a 5.5% mortgage rate and a 10% income loss, more than 90% of households would retain the capacity to service their mortgages. The potentially vulnerable group represented fewer than 10% of households and less than 4% of mortgage debt.
These are aggregate results. They do not mean every borrower is safe, but they suggest that the vulnerable tail remains relatively contained.
Some cautionary indicators are moving
The broader picture is strong, though not uniformly reassuring.
Household liabilities grew 8.2% year on year in Q1 2026, faster than the 6.8% increase in assets. Outstanding housing loans rose, while unsecured credit-card balances were reportedly rolling over faster. Some borrowers may therefore have thinner cash-flow buffers than their asset holdings imply.
Employment is another key link. Ministry of Manpower data showed retrenchments increasing from 3,690 in Q4 2025 to 3,830 in Q1 2026. Overall unemployment remained at 2%, with resident unemployment at 2.9% and citizen unemployment at 3.1%.
This is not a weak labour market by historical standards, but a prolonged rise in retrenchments would matter. Mortgage stress is usually a cash-flow problem before it becomes a balance-sheet problem.
HDB arrears require careful interpretation
A parliamentary reply covering December 2023 stated that approximately 15,600 households with HDB loans were at least three months in arrears, equivalent to 5.7% of households with outstanding HDB loans.
That figure is an older stock measure. It cannot be compared directly with H1 2026 private-bank mortgagee auction activity, and an HDB arrears case does not automatically result in compulsory recovery.
Indeed, HDB’s financial statements recorded housing-loan receivables of approximately S$41.39 billion at March 2024, against an impairment allowance of only S$2.1 million. This suggests that arrears have not translated into comparable realised loan losses.
HDB also generally provides restructuring and assistance before compulsory recovery. Its Homeowner Job Support initiative can allow eligible unemployed owners in HDB-loan arrears to reduce or defer instalments and suspend interest for up to one year while receiving employment support. Around 1,200 households were initially estimated to be potential beneficiaries, according to The Straits Times.
The appropriate conclusion is watchful, not alarmist: some borrowers are clearly struggling, but employment, household buffers and banking-asset quality remain relatively sound.
Historical Context: Elevated, but Below the 2019 Peak
Calling H1 2026 a “seven-year first-half high” captures the direction of the trend, but the more precise benchmark is that mortgagee listings reached their highest half-year level since H2 2019.
| Period | Mortgagee listings | Source and context |
|---|---|---|
| 2018 | 391 | Knight Frank full year, including repeats |
| 2019 | 630 | Knight Frank full year, including repeats |
| H2 2019 | 321 | ETC half-year benchmark |
| 2020 | 304 | Knight Frank; auctions disrupted by restrictions |
| Q1 2021 | 117 | Last Knight Frank quarter above 100 before 2026 |
| Full-year 2024 | 171 | Knight Frank |
| H1 2025 | 168 | ETC |
| H2 2025 | 165 | ETC |
| H1 2026 | 216 | ETC |
| H1 2026 | 212 | Knight Frank |
Selected Mortgagee Listing Benchmarks
The 2019 experience is instructive. Mortgagee listings were substantially higher, yet Singapore’s private residential market was not undergoing a system-wide price collapse. Elevated activity partly reflected lenders resolving older non-performing exposures and repeatedly marketing difficult properties.
The 2024 market also shows why listings and sales must be separated. Knight Frank recorded 171 mortgagee listings that year, but only 15 properties across all auction categories were successfully sold, producing S$28.7 million in transactions. EdgeProp attributed the low conversion partly to a gap between reserve prices and buyer expectations.
H1 2026 looks like an intensification of this selective process—not yet a return to the scale of 2019, and certainly not proof of a market-wide liquidation cycle.
What Buyers and Investors Should Watch
An increase in mortgagee listings creates more choice, but “mortgagee sale” is a legal and marketing category—not a promise of a deep discount.
Due diligence matters more than the distressed-sale label
Mortgagees generally sell properties on an “as is, where is” basis and provide fewer representations about their condition or history. Prospective buyers should investigate:
- Whether the property comes with vacant possession
- Whether an existing tenancy binds the mortgagee and purchaser
- Unauthorised alterations or additions
- Outstanding management charges
- Defects and reinstatement costs
- Title restrictions and easements
- Remaining lease and permitted industrial use
- GST exposure for industrial or commercial property
- The valuation required by the buyer’s bank
- The short financing and completion timeline
- Previous auction rounds and reserve-price changes
A low reserve relative to a seller’s original asking price is not necessarily a discount relative to current market value.
Short-lease industrial units need special scrutiny
The increase in industrial listings may appeal to yield-seeking investors, but apparent value can be misleading. A sub-30-year lease can affect both the entry financing and eventual exit.
An investor should model:
- A shorter bank loan tenure
- A larger required cash component
- Higher refinancing risk
- Declining residual value
- A smaller pool of future buyers
- Refurbishment and compliance expenditure
- Vacancy under a specialised permitted use
- The possibility that rental yield does not compensate for lease decay
The central question is not simply whether the auction price is below the last transaction. It is whether the asset will remain usable, financeable and saleable throughout the intended holding period.
Residential investors must account for Seller’s Stamp Duty
For residential properties acquired from 4 July 2025, Singapore extended the Seller’s Stamp Duty holding period from three to four years. The applicable rates are 16%, 12%, 8% and 4% for sales within the first four years, according to the Ministry of Finance.
| Disposal timing after purchase | Seller’s Stamp Duty rate |
|---|---|
| Within the first year | 16% |
| In the second year | 12% |
| In the third year | 8% |
| In the fourth year | 4% |
| After four years | No SSD under this schedule |
A buyer relying on a quick resale of an auction property could therefore face a large tax cost. Legal expenses, renovation, financing and vacancy can further reduce the margin.
Tenants should verify their legal position
A tenant occupying a mortgagee-sale property should not assume that the tenancy automatically continues—or automatically ends.
Practical steps include:
- Keeping the signed tenancy agreement and payment records
- Confirming who is legally authorised to collect rent
- Checking whether the tenancy binds the mortgagee and purchaser
- Documenting the security deposit
- Avoiding informal agreements about withholding rent
- Seeking legal advice where ownership or possession is disputed
- Preparing for non-renewal if a buyer intends to occupy or redevelop
At the broader market level, private rents still rose in Q2 2026. The auction figures do not point to a rental collapse. However, the large development pipeline and slightly higher vacancy rate could gradually restrain rental growth.
Why Singapore’s Safeguards Still Matter
Singapore’s housing credit framework limits leverage when a loan is granted, although it cannot prevent every later case of financial difficulty.
The principal safeguards include:
- A 55% Total Debt Servicing Ratio for property loans
- A 30% Mortgage Servicing Ratio for HDB flats and executive condominiums purchased directly from developers
- A maximum 75% loan-to-value ratio for a borrower’s first bank housing loan, subject to age and tenure conditions
- A maximum 75% HDB housing-loan LTV, reduced from 80% for applications received from 20 August 2024
These rules reduce the likelihood that new borrowers enter with excessively high leverage. They cannot eliminate stress caused by unemployment, business losses, illness, divorce or unexpected asset depreciation.
A further policy change may create an exit route for some private homeowners. From 28 July 2026, private residential property owners and former owners may buy a non-subsidised HDB resale flat without waiting 15 months, provided they do not take an HDB housing loan and dispose of the private property within six months of buying the flat, according to HDB.
For cash-capable owners, this could make downsizing easier and reduce the risk of retaining an unaffordable private property. It may also add some demand to the HDB resale market.
Supply policy is pulling in another direction. The H2 2026 Confirmed List can yield around 4,745 private homes, bringing the full-year potential supply to approximately 9,320 units—more than 50% above the ten-year annual average.
More supply can improve choice and moderate medium-term price and rental pressures. It can also widen performance differences between new projects and older properties with weaker locations, shorter leases or poorer financing prospects.
So, Is Housing Stress Rising?
Yes—but the stress appears selective rather than systemic.
The evidence for rising stress is real:
- ETC mortgagee listings increased 28.6% year on year.
- Mortgagee sales formed 74.0% of all auction listing activity.
- Knight Frank recorded more than 100 mortgagee listings in two consecutive quarters.
- Industrial listings rose sharply.
- Some borrowers may still be absorbing the delayed effects of earlier rate resets.
- Household liabilities grew faster than assets in Q1 2026.
- Retrenchments increased modestly.
But the evidence against a broad housing crisis is also strong:
- The 216 records are listing appearances, not confirmed unique foreclosures.
- A large share of the activity involves industrial and commercial assets.
- Only 13 properties across all auction types sold under the hammer in H1.
- Private residential prices rose 1.4% in H1.
- Private rents continued to increase.
- Singapore completed more than 24,000 private and HDB resale housing transactions.
- Available mortgage delinquency and bank non-performing-loan indicators remain low.
- Household assets and liquid financial buffers remain substantial.
- Employment conditions remain relatively firm.
ETC auction head Joy Tan linked the larger mortgagee share to tighter financing conditions, while also observing that a functioning resale market lets some owners sell voluntarily before foreclosure. Her interpretation, reported by The Business Times, was consistent with a selective market rather than broad distress.
Knight Frank’s Tan Tee Khoon said the sustained rise could indicate that banks are beginning to act on non-performing mortgages as borrower pressure increases. At the same time, successful sales still depend on realistic reserve prices and acceptable asset quality.
BMI economist Lee Yen Nee, meanwhile, characterised Singapore household balance sheets as healthy and systemic risk as very low, noting that some debt growth may be associated with wealthier, cash-rich households.
These interpretations can all be true simultaneously. Banks can enforce more problematic loans at the margin while the great majority of households and the financial system remain resilient.
The Indicators That Matter Next
The headline listing number will remain useful, but several deeper indicators will determine whether H1 2026 was a temporary rise or the beginning of a broader trend.
Watch for:
-
Unique-property counts: If repeat listings explain much of the rise, the increase in distressed owners may be smaller than the headline suggests.
-
Completed mortgagee sales: A sharp increase in actual sales—especially at widening discounts—would signal that lenders and buyers are converging at lower prices.
-
Residential versus industrial composition: Continued industrial concentration would point more towards commercial refinancing and lease-decay issues than household distress.
-
Mortgage arrears and non-performing loans: A broad increase across banks and borrower groups would be more serious than higher auction marketing activity alone.
-
Employment and household cash flow: Rising unemployment or sustained retrenchments could turn isolated repayment problems into a wider trend.
-
Resale market liquidity: As long as owners can sell conventionally at reasonable prices, many can avoid creditor enforcement.
-
Project-level price dispersion: Stable national indices can conceal weakness in older, highly leveraged or less desirable projects.
The most valuable missing data include the number of unique properties among the 216 listings, the number sold later by private treaty, the proportion of owner-occupied homes and the length of delinquency before enforcement.
Until those gaps are filled, mortgagee listings should be treated as a leading indicator of concentrated stress and creditor action—not a national default-rate statistic.
Food for Thought
-
If a property has appeared in three auction rounds, should it influence our view of market stress three times—or only once?
-
How much of the industrial mortgagee increase reflects borrower cash-flow trouble, and how much reflects structural lease decay that lower interest rates cannot repair?
-
Would a rise in completed mortgagee sales be reassuring because market liquidity is improving, or concerning because lenders are accepting deeper discounts?
-
Can national price indices remain firm while older projects, highly leveraged investors and short-lease assets experience a much harsher market?
-
Which indicator deserves the most attention next: auction listings, mortgage arrears, unemployment, bank non-performing loans or resale transaction liquidity?
A Signal to Monitor, Not a Crisis to Declare
The 216 mortgagee listings in H1 2026 are a legitimate warning signal. They show that secured creditors are marketing more assets and that some borrowers—particularly those holding industrial properties and selected private homes—are under greater pressure.
They do not establish 216 unique foreclosures, 216 failed households or a system-wide wave of mortgage defaults. Few properties sold at auction, conventional housing turnover remained active, private prices and rents rose, and household and banking indicators continued to show substantial resilience.