Singapore office investment sales reached approximately S$11.6 billion in the first half of 2026, yet 11% of the island’s completed office stock was vacant at the end of June. At first glance, those numbers seem incompatible. Why would investors spend billions buying offices when more than one in ten square metres is unoccupied?
The short answer is that Singapore is experiencing three different trends at once: a recovery in capital-market activity, strong demand for selected prime offices, and an islandwide vacancy overhang that includes newer completions and less competitive buildings.
Investment sales, rental performance and physical vacancy do not measure the same thing. A multibillion-dollar ownership transfer can lift transaction volume without filling any space. Rents can rise in premium buildings while falling in smaller or older units. Vacancy can also increase when a newly completed building enters the official stock count before its committed tenants finish their fit-outs and move in.
The more accurate description, therefore, is not that the entire Singapore office market is booming. It is that prime-office leasing is tight, investment activity has rebounded, and secondary or newly completed space is keeping overall vacancy elevated.
Understanding those distinctions matters to office investors, strata buyers, business owners and anyone trying to interpret property headlines.
First, Correcting the S$10.8 Billion Office-Sales Headline
One figure circulating around the market requires clarification: Singapore did not record exactly S$10.8 billion of office transactions during H1 2026.
According to Colliers, S$10.8 billion was the value of commercial investment activity in Q1 2026. It was a first-quarter figure, and “commercial” covered more than offices alone. That amount formed part of S$16.6 billion in total real-estate investment sales during the quarter.
For the full first half, Cushman & Wakefield calculated approximately S$11.6 billion in office investment sales. Offices accounted for 32.9% of the consultancy’s S$35.2 billion total across all property sectors.
| Reported figure | Period | Scope | Source |
|---|---|---|---|
| S$10.8 billion | Q1 2026 | Commercial investment activity | Colliers |
| S$16.6 billion | Q1 2026 | Total real-estate investment sales | Colliers |
| S$11.6 billion | H1 2026 | Office investment sales | Cushman & Wakefield |
| S$35.2 billion | H1 2026 | Total real-estate investment sales | Cushman & Wakefield |
Consultancies can arrive at different totals because they use different minimum transaction sizes and may treat fund formations, partial interests, Government Land Sales and announced versus completed transactions differently. Figures from separate datasets should not be combined as though they were calculated on identical terms.
The defensible headline is this: Singapore office investment sales reached approximately S$11.6 billion in H1 2026, while Q1 commercial investment activity amounted to S$10.8 billion.
That correction does not make the capital-market rebound insignificant. H1 total-property investment volume of S$35.2 billion was already close to Cushman & Wakefield’s S$36.8 billion full-year record in 2017. But the composition of the 2026 figure is just as important as its size.
Three Statistics, Three Different Questions
When people speak of “the office market”, they often mix together statistics measuring ownership, leasing prices and physical space. Separating them resolves much of the apparent contradiction.
| Gauge | The question it answers | Q2 2026 signal | What it cannot establish |
|---|---|---|---|
| Investment-sales volume | How much property value changed hands? | Exceptionally strong | Whether more office space was occupied |
| Rental performance | What prices were agreed in leases? | Rising overall, with prime offices outperforming | Whether every building or unit type enjoyed growth |
| Physical vacancy | What share of completed stock was unoccupied? | 11% islandwide | Whether the most desirable CBD offices had 11% vacancy |
| Workplace utilisation | How intensively are leased offices used each day? | Not measured by official vacancy | Whether occupied desks are full amid hybrid work |
The Urban Redevelopment Authority compiles commercial prices using sources such as caveats and stamp-duty information. Its rental statistics come from tenancy agreements, while office vacancy is principally measured through quarterly electronic and mail surveys of completed and partially completed developments.
These methods observe different events.
For example, imagine a fully occupied office tower being sold from one institutional owner to another for S$2 billion. Investment-sales volume rises by S$2 billion, but occupied space and physical vacancy remain unchanged. If tenants renew at higher rents, the rental measure rises too—even though no additional space has been taken up.
The practical lesson is simple: deal value is not space demand, rental growth is not universal, and physical vacancy is not the same as availability in the buildings tenants most want.
What Actually Happened in Q2 2026
URA’s official Q2 figures do not describe a market in which demand disappeared. They show that supply grew faster than occupation.
According to URA:
- Central Region office prices increased 0.4% quarter on quarter, after rising 0.2% in Q1.
- Central Region office rents rose 0.8%, reversing a 0.2% decline in Q1.
- The rental index was 0.9% higher year on year.
- Occupied office space increased by a net 8,000 sq m, or roughly 86,111 sq ft.
- Completed office stock increased by a net 19,000 sq m, or approximately 204,514 sq ft.
- Islandwide vacancy consequently rose from 10.8% to 11%.
- About 47,374 sq m, or around 510,000 sq ft, received Temporary Occupation Permit status during H1.
- The islandwide supply pipeline stood at 848,000 sq m of gross floor area, or approximately 9.13 million sq ft.
| Q2 2026 measure | Change or level | Interpretation |
|---|---|---|
| Central Region office prices | +0.4% QoQ | Asset prices continued to edge higher |
| Central Region office rents | +0.8% QoQ | Leasing prices recovered from Q1’s decline |
| Occupied space | +8,000 sq m net | Physical demand still increased |
| Completed stock | +19,000 sq m net | Supply increased faster than occupation |
| Islandwide vacancy | 11% | Up 0.2 percentage point from Q1 |
| H1 space receiving TOP | 47,374 sq m | New space entered the completed-stock pool |
Vacancy rose because the denominator and numerator changed at different speeds. New completed stock expanded by 19,000 sq m on a net basis, while occupied space grew by only 8,000 sq m.
That is materially different from a quarter in which tenants collectively surrendered space and occupied stock contracted.
The Historical Trend Is Less Alarming Than One Quarter Suggests
Islandwide office vacancy was 11.4% in Q2 2025. It then declined for three consecutive quarters before ticking back up in Q2 2026.
Singapore Islandwide Office Vacancy Rate (%)
The latest result interrupted an improving trend, but it did not by itself establish a fresh deterioration cycle. At 11%, vacancy was still below its level a year earlier.
How Shaw Tower Raised Vacancy Before Tenants Moved In
Shaw Tower illustrates why newly completed supply can make vacancy rise even when leasing activity is healthy.
The development received its Temporary Occupation Permit in mid-June 2026 and added about 435,000 sq ft of office space near the end of the quarter. Tenants including Allianz, Adyen, Sanofi-Aventis Singapore and The Great Room had reportedly committed space.
But a signed lease is not the same as physical occupation.
After a building receives TOP, tenants may still need to:
- Complete interior design and fit-out works
- Install networking, security and other technology
- Obtain operational approvals
- Test building systems
- Coordinate the expiry or surrender of an existing lease
- Move employees, equipment and records in phases
As CBRE’s Tricia Song explained to The Business Times, tenants need time to fit out their premises and physically relocate.
The statistical effect follows a predictable sequence:
This is sometimes called a completion-to-occupation lag. The new building appears immediately in completed supply, but tenant occupation arrives progressively.
There is also a second-order effect. When tenants eventually move into Shaw Tower, the offices they leave behind may become vacant. Occupancy can improve in the new development while “backfill space” appears in older buildings elsewhere.
That is one reason islandwide vacancy may remain elevated even when a prominent new tower leases successfully.
The 11% Vacancy Rate Hides a Much Tighter Prime Market
The most important distinction is geographical and qualitative. URA’s 11% vacancy rate is islandwide, encompassing different office grades, ages and locations. It is not the vacancy rate for the most sought-after Grade A towers in the Core CBD.
CBRE placed Core CBD Grade A vacancy at just 3.3% in Q2 2026. Cushman & Wakefield’s broader CBD Grade A basket recorded 4.7%, while Marina Bay vacancy was only 2.1%.
Q2 2026 Office Vacancy Rates by Market Basket (%)
These are not competing estimates of precisely the same group of buildings. Each organisation defines geography and building quality differently. CBRE, for example, treats Shaw Tower as Fringe CBD, so the completion did not raise its Core CBD vacancy rate. Cushman & Wakefield uses a broader CBD Grade A basket in which Shaw Tower’s completion affected the quarter’s result.
That methodological difference helps explain why CBRE’s Core CBD vacancy fell while Cushman & Wakefield’s broader Grade A vacancy increased.
| Market measure | Q2 2026 result | Coverage issue |
|---|---|---|
| URA islandwide office vacancy | 11% | Includes prime, secondary, peripheral and newly completed stock |
| Cushman & Wakefield CBD Grade A vacancy | 4.7% | Broader Grade A CBD basket; affected by Shaw Tower |
| CBRE Core CBD Grade A vacancy | 3.3% | Shaw Tower classified outside its Core CBD basket |
| Cushman & Wakefield Marina Bay vacancy | 2.1% | Premium submarket with particularly limited availability |
CBRE’s data also show how dramatically conditions have tightened in its selected prime market. Core CBD Grade A vacancy fell from 7.8% in Q4 2024 to 3.3% in Q2 2026.
CBRE Core CBD Grade A Vacancy (%)
According to CBRE, Core CBD Grade A rent reached S$12.50 psf per month in Q2, up 0.8% from the previous quarter. It was the sixth consecutive quarterly increase, bringing H1 growth to 1.6%. CBRE retained an approximately 5% full-year rental-growth forecast.
Cushman & Wakefield recorded 0.9% quarterly and 2.2% H1 rental growth for its CBD Grade A basket. Separately, JLL placed Q2 CBD gross effective rent at S$12.19 psf per month, up 4.3% year on year, according to Singapore Business Review.
Again, the differing numbers reflect differing building baskets and definitions. Their shared signal is that premium offices remained relatively tight and rents continued to rise.
Flight-to-Quality Is Dividing the Singapore Office Market
The divergence is being reinforced by “flight-to-quality”: tenants are prioritising newer, greener, well-connected and operationally efficient offices, even when they are not expanding their total footprint.
A company might surrender 100,000 sq ft across several older locations and lease 85,000 sq ft in one efficient Grade A tower. Its overall area contracts, but demand and rental competition increase in the preferred building.
Typical reasons for such moves include:
- Efficient floor plates: Fewer awkward corners and columns can allow the same workforce to fit into less space.
- MRT connectivity: Direct or sheltered access reduces friction for employees and visitors.
- Energy performance: Efficient systems can lower operating costs and support corporate sustainability targets.
- Modern infrastructure: Newer air-conditioning, connectivity, security and backup systems reduce operational risk.
- Employee experience: Amenities and hospitality-style shared spaces can help companies attract staff back to the office.
- Corporate profile: A high-quality address can matter to banks, asset managers, law firms and regional headquarters.
- Consolidation: Several fragmented premises can be combined into one location.
Cushman & Wakefield recorded 484,376 sq ft of net absorption in the Downtown Core between Q3 2025 and Q2 2026, substantially more than in other submarkets. Wong Xian Yang attributed the concentration to occupiers’ emphasis on accessibility, corporate image, Grade A availability and access to talent.
Recent demand reportedly came from banking, insurance, wealth and asset management, professional services, fintech and artificial-intelligence businesses. Shell pre-committed approximately 100,000 sq ft at Asia Square Tower 1, while Databricks expanded at IOI Central Boulevard Towers, according to The Business Times.
Financial services remain a credible source of structural demand. Figures published in July showed that the sector:
- Represented 14% of Singapore’s GDP
- Grew by 4.3% in 2025
- Created an average of 4,200 net jobs annually from 2021 to 2025
- Oversaw assets under management that increased 10.1% to S$6.7 trillion
These figures were reported by The Straits Times.
Rising Office Rents Are Not Universal
Even within official lease data, rental performance varies sharply by unit size. URA-derived Q2 Category 1 median rents published by EdgeProp showed the strongest annual growth among units measuring more than 500 sq m but no more than 1,000 sq m.
| Office floor area | Q2 2026 median rent | Year-on-year change |
|---|---|---|
| Up to 100 sq m | S$8.95 psf/month | -15.5% |
| More than 100–200 sq m | S$11.20 psf/month | +4.6% |
| More than 200–500 sq m | S$12.05 psf/month | +6.8% |
| More than 500–1,000 sq m | S$12.70 psf/month | +12.4% |
| More than 1,000 sq m | S$12.25 psf/month | +4.4% |
Q2 2026 Office Median Rent Change by Floor Area (%)
The median for the smallest units declined 15.5% year on year, while the 500–1,000 sq m band increased 12.4%. Differences in the leases captured during each period can shift medians, so this should not be treated as a perfect like-for-like index. It nevertheless demonstrates why a single rental-growth headline cannot describe every office unit.
Knight Frank’s Leonard Tay has similarly cautioned that older buildings with obsolete specifications, poor sheltered transport access or weaker amenities face greater vacancy and rental pressure.
Singapore increasingly has two office markets operating side by side:
| Preferred modern offices | Less competitive offices |
|---|---|
| Tight availability in selected Core CBD towers | Higher vacancy across parts of older or peripheral stock |
| Stronger tenant demand and rental growth | Greater pressure on rents and incentives |
| Efficient, green and well-connected | May require retrofit or repositioning |
| Large institutional buyer interest | More building-specific and tenure-related risk |
| Scarce near-term prime supply | Potential backfill as tenants relocate |
Why Singapore Office Investment Sales Surged
If physical occupation was not the main cause, what drove the H1 office-sales boom? Four factors stand out: a large fund formation, a major tower sale, lower borrowing costs and investor expectations about future income.
1. One S$8.2 Billion Fund Formation Dominated the Total
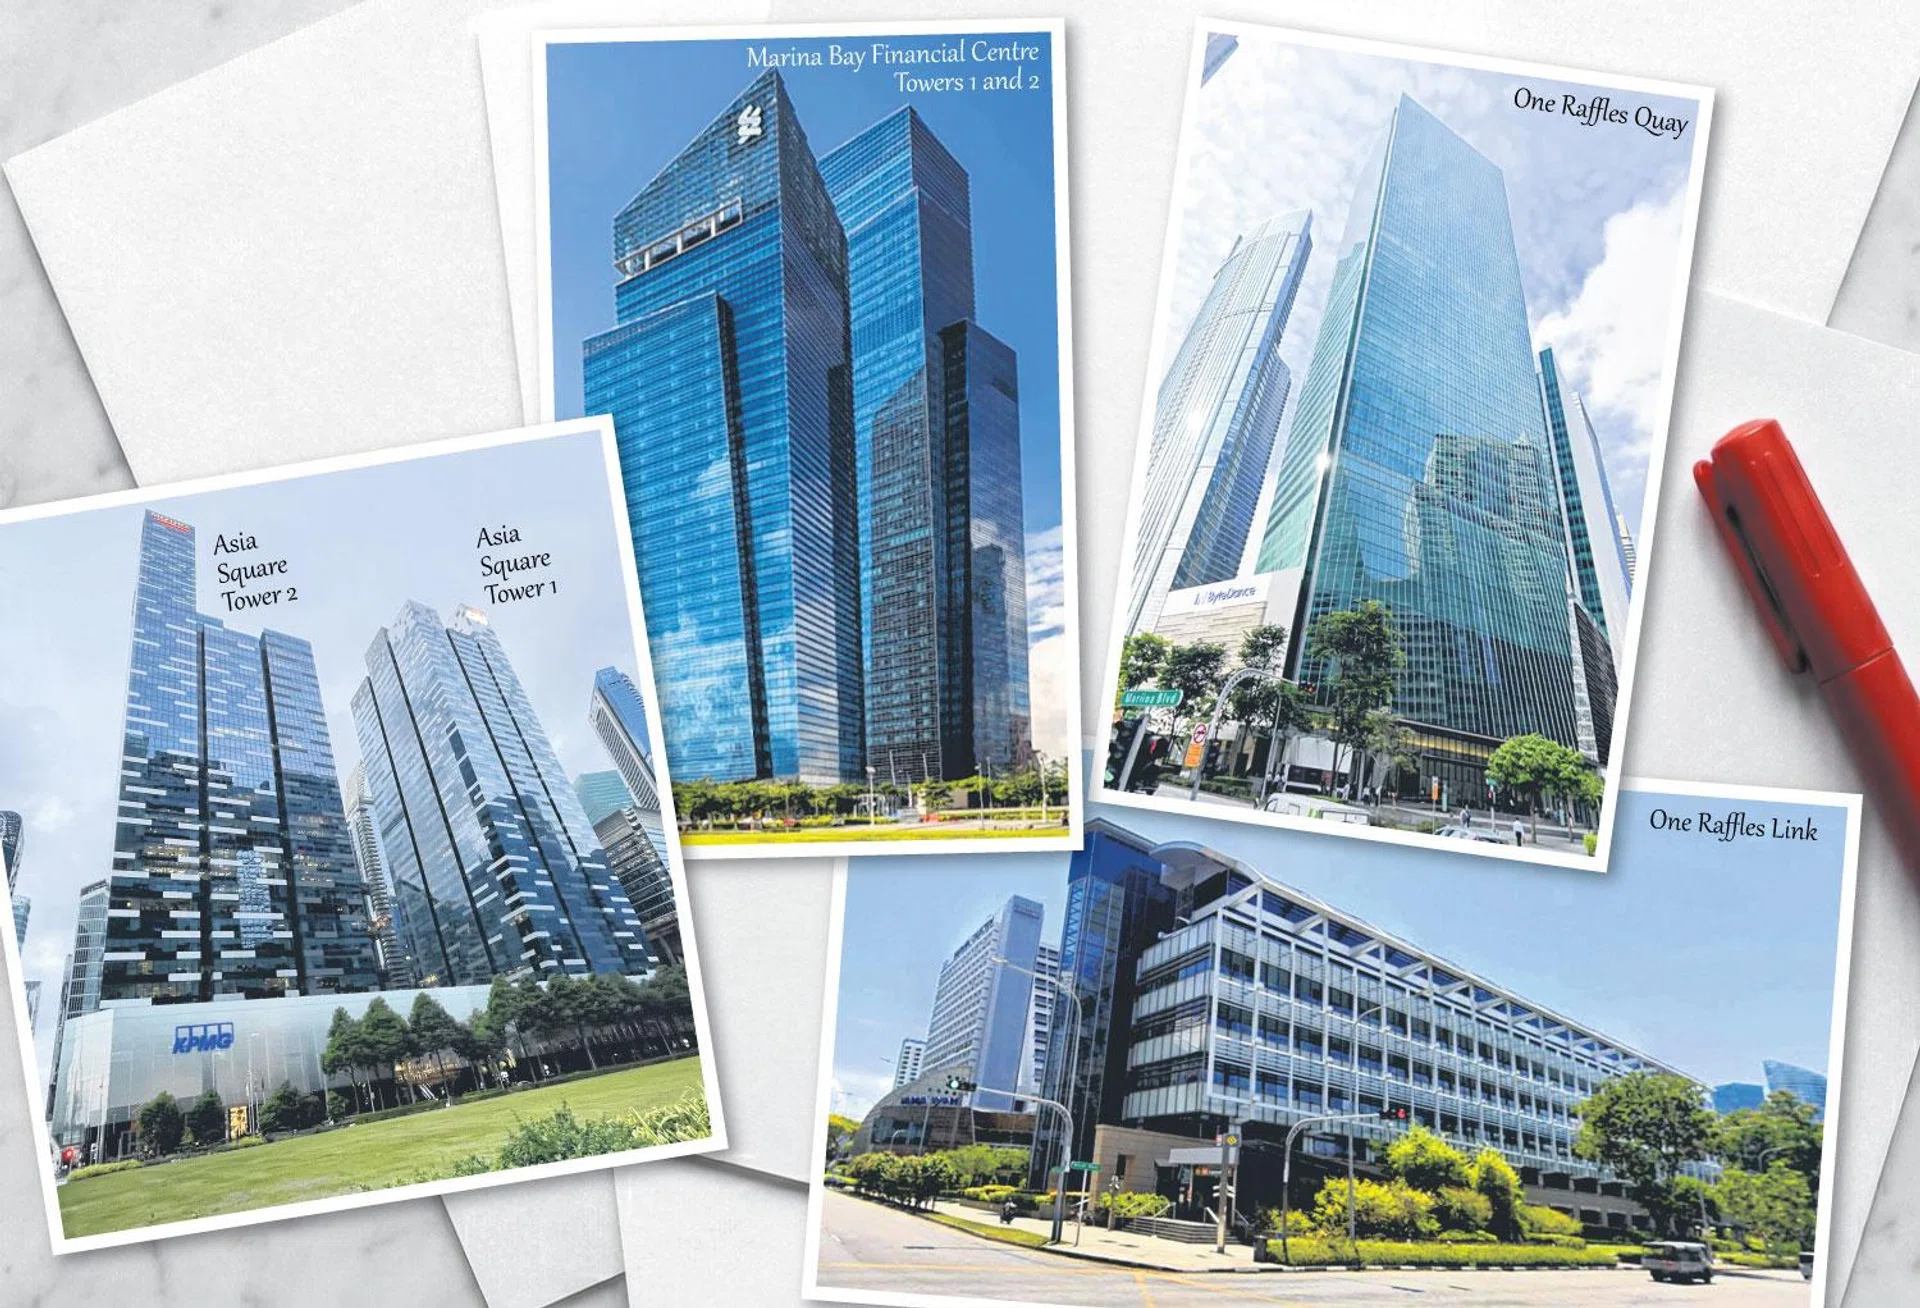
Hongkong Land formed the Singapore Central Private Real Estate Fund, or SCPREF, with S$8.2 billion in gross asset value and 2.6 million sq ft of effective net lettable area.
According to Hongkong Land’s announcement, the seed portfolio comprised:
- Asia Square Tower 1
- One Raffles Link
- One-third interests in Marina Bay Financial Centre Towers 1 and 2
- A one-third interest in Marina Bay Link Mall
- A one-third interest in One Raffles Quay
The platform is targeting at least S$15 billion in gross asset value.
The initial S$8.2 billion represents the gross value of assets placed into a new investment structure. It does not mean a collection of unrelated buyers spent S$8.2 billion acquiring vacant buildings through conventional open-market sales. Hongkong Land remains the manager while the platform brings in third-party institutional capital and recycles ownership.
The distinction matters because a fund formation can create an enormous capital-market statistic without creating one additional occupied desk.
2. Asia Square Tower 2 Produced a S$2.476 Billion Deal
CapitaLand Integrated Commercial Trust agreed to sell Asia Square Tower 2 to IOI Properties for S$2.476 billion, according to CICT.
The transaction represented:
- Approximately S$3,200 psf of net lettable area
- 95.8% average occupancy as at 31 March
- A 3% exit yield
- A 9.9% premium to CICT’s end-2025 valuation
- Expected completion in H2 2026, subject to conditions
CICT said it was recycling capital from a 99-year leasehold office asset into the freehold Paragon integrated development at a higher yield. That rationale describes a portfolio-allocation decision: selling one asset to redeploy capital into another with a different tenure and return profile.
It does not indicate that Singapore companies suddenly required S$2.476 billion worth of additional office space.
3. A Handful of Transactions Explains Almost the Entire Headline
The estimated S$600 million to S$630 million purchase of 78 Shenton Way adds another major transaction.
Using the upper end of that estimate, three events account for approximately:
| Event | Approximate value |
|---|---|
| SCPREF seed portfolio | S$8.20 billion |
| Asia Square Tower 2 | S$2.476 billion |
| 78 Shenton Way | S$0.63 billion |
| Combined | S$11.306 billion |
| Cushman & Wakefield H1 office total | S$11.6 billion |
The combined S$11.306 billion is roughly 97% of Cushman & Wakefield’s H1 office-investment total. This is an inference using reported transaction values, and differences in how transactions are classified or timed may affect an exact comparison. Even so, it powerfully illustrates the concentration behind the headline.
A surge in dollar volume need not mean a surge in the number of buildings sold.
Q2 Central Region strata-office activity recorded only 65 caveats, slightly above 63 in Q1 but well below 93 in Q2 2025. The same quarter could therefore contain enormous institutional transaction value and relatively modest strata-office deal counts.
Several trophy buildings, including Marina One, One Raffles Place and Bugis Junction Towers, were also being marketed. A building offered for sale is not a completed transaction, and the credible buyer pool narrows substantially once pricing exceeds S$500 million.
4. Lower Financing Costs Brought Buyers Back
Financing conditions changed meaningfully during 2025. CBRE estimates reported by The Business Times placed office borrowing costs at approximately 2.5%–3.5% by end-2025, down from roughly 4%–5% at end-2024.
Prime offices commonly trade at net yields of around 3%–4%. When borrowing costs were near or above property yields, leveraged purchases could produce weak or negative carry before other expenses. Lower financing costs reopened the possibility of positive cash flow and allowed buyers sidelined during the higher-rate period to reconsider deals.
Knight Frank’s Galven Tan observed that falling financing costs were bringing back investors who had stayed out of the market from H2 2022 through late 2024.
By 20 April 2026, JLL’s office investment-sales tally had already reached S$10.74 billion, 2.7 times its approximately S$4 billion total for the whole of 2025. Buyers included REITs, listed companies, private capital and overseas institutions.
5. Investors Buy Future Income, Not Today’s Aggregate Vacancy
Commercial-property values are shaped by expected future net operating income and the return investors require for owning that income stream. Today’s islandwide vacancy is only one input.
A buyer may pay a strong price if it expects:
- Prime vacancy to remain low
- Rents to rise when existing leases expire
- Borrowing costs to decline further
- Capitalisation rates to compress
- Asset enhancement to increase rents or efficiency
- Redevelopment to unlock additional value
- Obsolete stock to be withdrawn through conversion
- Singapore to retain its safe-haven and regional-headquarters appeal
Colliers placed average Core CBD Premium and Grade A capital values at S$3,100 psf in Q1 2026, with a net yield of 3.66%. Its conclusion was selective rather than universally bullish: prime pricing was resilient, while secondary transactions were more value-driven.
Catherine He of Colliers summarised the pattern: “Capital is concentrating in assets with clear income visibility, durable tenant demand and defensible long-term positioning.”
That is why investment volume can surge alongside 11% islandwide vacancy. Buyers are concentrating on specific assets whose income prospects may be much stronger than those of the average office building.
The Evidence Against a Universal Office Boom
Two secondary-market sales show how tenure, specifications and redevelopment potential can produce very different outcomes from those of trophy towers.
78 Shenton Way was reportedly acquired for S$600 million to S$630 million, or approximately S$1,730 psf on existing net lettable area. The property had about 56 years remaining on its 99-year lease.
158 Cecil Street reportedly sold for S$175 million, around 27% below the S$240 million paid for it in 2015.
These are not necessarily distressed transactions. Their pricing reflects building-specific factors that can include remaining tenure, capital expenditure, existing income, redevelopment potential and buyer strategy. But they demonstrate why an Asia Square transaction cannot be used as a valuation shortcut for every CBD office.
For strata-office buyers, the difference is especially important. A small unit in an older building does not automatically share the liquidity, tenant quality, management control or repositioning options of an institutional-grade tower.
Supply Is Tight Through 2027, but 2028 Is the Test
The near-term Grade A development pipeline supports the stronger prime-market outlook:
- Shaw Tower was the principal completion in 2026.
- Newport Tower represents limited new supply in 2027.
- A more meaningful cluster is expected around 2028, including The Skywaters, The Clifford, the redeveloped Singtel Comcentre and Union Square Central.
JLL estimates that only around 4 million sq ft of islandwide office supply will be completed from 2026 to 2030, including 2.2 million sq ft in the CBD. The implied CBD average is below the previous decade’s annual net take-up of approximately 0.6 million sq ft.
CBRE separately projected average islandwide completions of about 770,000 sq ft per year from 2026 to 2030, around 40% below the 2016–2025 average of 1.28 million sq ft.
June Chua of Newmark described the pipeline of Premium and Grade A offices before 2028 as offering “little reprieve to tenants”.
This creates a relatively supportive setup for prime rents through 2027—but it is not a permanent guarantee.
The 2028 cluster could affect the market in two ways:
- New premium projects may compete directly for large occupiers.
- Tenants relocating into those projects may release substantial space in older towers.
Even if the new developments achieve healthy leasing commitments, their success can create backfill vacancy elsewhere. Owners of ageing offices may need to offer incentives, upgrade their buildings or consider redevelopment.
Policy May Remove Older Offices While Creating New Competition
Government policy adds another layer to the supply picture.
CBD Incentive Scheme 2.0
The CBD Incentive Scheme 2.0 runs from 7 February 2025 to 6 February 2030. It encourages qualifying older office developments in designated areas to redevelop into mixed-use projects incorporating uses such as residential, hospitality and commercial space.
Under URA’s guidelines, higher development intensity may be granted, subject to planning approval and conditions that can include a meaningful reduction in existing office space.
The scheme can:
- Remove obsolete offices from the market
- Support the scarcity value of remaining modern CBD buildings
- Create redevelopment value for ageing assets
- Reduce available stock while projects are rebuilt
- Eventually return modern office components alongside other uses
Possible Land Betterment Charge, sustainability requirements and other planning conditions must still be considered. Individual strata subdivision of the new commercial component is generally restricted.
Decentralised Employment Centres
The government has not recently released new standalone CBD office sites, while planning policy continues to support employment centres outside the traditional Downtown Core.
URA’s second-half 2026 Government Land Sales programme includes a large Jurong Lake District mixed-use site capable of providing at least 40,000 sq m of office space. This is a longer-term decentralised supply source rather than immediate competition for Core CBD buildings.
Mandatory Energy Improvement Requirements
Since 30 September 2025, the Mandatory Energy Improvement regime has applied to energy-intensive commercial buildings with at least 5,000 sq m of gross floor area.
According to the Building and Construction Authority, an owner receiving an audit notice must:
- Commission an energy audit and improvement plan
- Submit the report within one year
- Implement improvement measures within three years
- Reduce energy use by 10% from the relevant three-year baseline
- Demonstrate that the improvement is maintained
The regime can impose retrofit expenditure on inefficient older offices. Over time, those works may lower operating costs, but they also strengthen the relative appeal of modern, green-certified buildings that already meet higher standards.
What the Divergence Means for Office Investors
The H1 figures support a view that liquidity has returned to prime Singapore offices. They do not support indiscriminate buying.
Whole-building and institutional investors should distinguish between:
- In-place occupancy and market vacancy: A nearly full asset can operate in a submarket with higher average vacancy.
- Signed leases and physical move-ins: Pre-commitment does not always mean immediate rent commencement or occupation.
- Face rent and effective rent: Incentives, rent-free periods and fit-out support affect actual income.
- Prime CBD and islandwide vacancy: The relevant competitive set depends on the building.
- Freehold and leasehold tenure: A shortening 99-year lease can influence financing, exit value and redevelopment options.
- Stable income and redevelopment assumptions: Potential is not the same as approved or economically viable redevelopment.
- Gross fund asset value and new cash investment: A fund formation can count the full value of seeded assets even when third-party equity is only part of that sum.
Due diligence should examine:
- Tenant concentration and covenant quality
- Weighted average lease expiry
- Rent-review and lease-break dates
- Upcoming capital expenditure
- Refinancing terms and interest-rate sensitivity
- Energy performance and retrofit obligations
- Remaining land tenure
- Future competing supply
- Backfill exposure when anchor tenants relocate
The headline vacancy rate matters, but the building’s own tenant profile and competitive position matter more.
What It Means for Strata-Office Buyers
Commercial property can appeal to buyers who want an alternative to residential investment, partly because pure commercial property is not subject to Additional Buyer’s Stamp Duty. That advantage should not be mistaken for an absence of acquisition costs or liquidity risk.
Key considerations include:
- Pure commercial property remains subject to Buyer’s Stamp Duty. IRAS applies marginal non-residential rates of up to 5% for the portion above S$1.5 million.
- GST may apply when the seller is GST-registered.
- Foreigners can generally acquire commercial and industrial property without Residential Property Act approval, according to the Singapore Land Authority.
- A property zoned “Commercial & Residential” is treated differently and may require approval.
- An individual unit does not offer the same tenant diversification or control as an entire building.
- Strata liquidity can be thin, as the fall from 93 quarterly caveats in Q2 2025 to 65 in Q2 2026 illustrates.
A strata buyer should assess the specific unit’s:
- Floor efficiency and natural light
- Lift access and lobby quality
- Building management and sinking fund
- Service charges and air-conditioning arrangements
- Remaining tenure
- Tenant demand at its unit size
- Proximity to MRT stations and amenities
- Competing fitted units
- Prospects for collective redevelopment
The S$11.6 billion investment-sales headline says little about how quickly one small office unit can be leased or resold.
What It Means for Office Tenants
For tenants, the coexistence of tight prime supply and elevated islandwide vacancy creates different negotiating environments.
Tenants Seeking Core CBD Grade A Space
Businesses requiring large, contiguous floors in premium buildings should:
- Begin searches and renewal talks early.
- Consider pre-committing before a building is completed.
- Compare total occupancy cost rather than face rent alone.
- Budget for fit-out, reinstatement, service charges and technology infrastructure.
- Test whether a smaller but more efficient floor can offset a higher psf rent.
- Expect landlords in the tightest buildings to retain negotiating power through 2027.
A nominally expensive Grade A floor can sometimes cost less per employee if its design permits more efficient use of space and its energy systems reduce operating expenses.
Cost-Sensitive Tenants
The 11% islandwide vacancy rate is more useful as evidence that alternatives exist somewhere in the market.
Cost-sensitive occupiers may find opportunities in:
- Older CBD buildings with fitted space
- Fringe CBD locations
- Decentralised business districts
- Smaller units facing softer demand
- Buildings likely to receive backfill space after anchor tenants relocate
Such tenants should negotiate incentives when a building has weaker transport access, ageing systems or significant upcoming vacancy. The best bargaining window may appear after large occupiers move into newer developments and their former landlords need replacement tenants.
The 11% figure therefore does not prove that prime landlords lack pricing power. It suggests that tenants willing to compromise on age, specifications or location may have more choices.
The Main Risks Behind the Prime-Office Optimism
The case for prime offices is credible, but it is not risk-free.
1. The 2028 Supply Wave
The market may look different when several major developments complete around the same time. Direct competition and backfill vacancy could loosen conditions, especially if economic growth slows.
2. AI Could Increase or Reduce Office Demand
AI and technology companies currently contribute to leasing demand. But Mogul.sg’s Nicholas Mak has noted that automation could eventually reduce white-collar headcount. The same industry can be a near-term tenant and a longer-term space-efficiency risk.
3. Economic and Geopolitical Uncertainty
Singapore’s Ministry of Trade and Industry maintained its official 2%–4% GDP growth forecast for 2026 in May while noting increased downside risks. A weaker global economy could delay expansion, reduce hiring and lengthen leasing decisions.
4. Hybrid Work Complicates the Meaning of “Occupied”
An office is counted as occupied when it is leased and physically taken up, even if many desks sit empty on work-from-home days. Official vacancy measures real-estate occupation, not daily workplace utilisation.
Businesses can therefore reduce their footprints at lease expiry even while current vacancy appears stable.
5. Transaction Volume Is Highly Concentrated
Removing the SCPREF formation and Asia Square Tower 2 sale would drastically reduce the H1 office-sales total. A few enormous transactions are not evidence of broad liquidity at every price point.
6. Older Leasehold Assets Face Tenure Risk
Strong Grade A rents do not erase the effects of a shortening land lease. Financing options, redevelopment economics and exit values can differ substantially from those of freehold or newer leasehold assets.
7. The Trophy-Asset Buyer Pool Is Finite
Only a limited number of REITs, sovereign funds, institutions and major private investors can pursue assets costing S$500 million or more. Geopolitical or financing shocks can quickly reduce that pool.
8. Retrofit and Regulatory Costs Can Change Returns
Energy upgrades may improve long-term operating performance, but near-term capital expenditure can reduce returns. Redevelopment incentives also remain subject to planning conditions and charges.
Food for Thought
-
If three large transactions account for roughly 97% of H1 office investment sales, should the market be described as highly liquid—or highly concentrated?
-
As tenants move into efficient Grade A towers, will the bigger opportunity emerge in premium offices or in older buildings priced for repositioning?
-
Does an 11% physical vacancy rate remain the right measure of slack when hybrid work means even leased offices may be underused?
-
Will the 2028 completion wave satisfy years of pent-up demand, or create enough backfill space to shift negotiating power toward tenants?
-
If AI companies expand today but automation reduces office headcount later, how much future rental growth should investors confidently underwrite?
Conclusion: One Office Market, Several Different Realities
Singapore can have surging office sales and 11% vacancy because the two statistics observe different parts of the market. H1 investment volume was dominated by an S$8.2 billion fund formation and a small number of trophy transactions. Meanwhile, URA’s vacancy figure covered all completed office stock and rose partly because supply entered the count faster than committed tenants could move in.
Within that islandwide total, selected Grade A CBD buildings were far tighter, with vacancy estimates of 3.3% to 4.7% and continued rental growth. Older, smaller and less connected offices faced a more difficult reality. The arrival of new towers can widen that split by attracting tenants from secondary buildings and leaving backfill space behind.