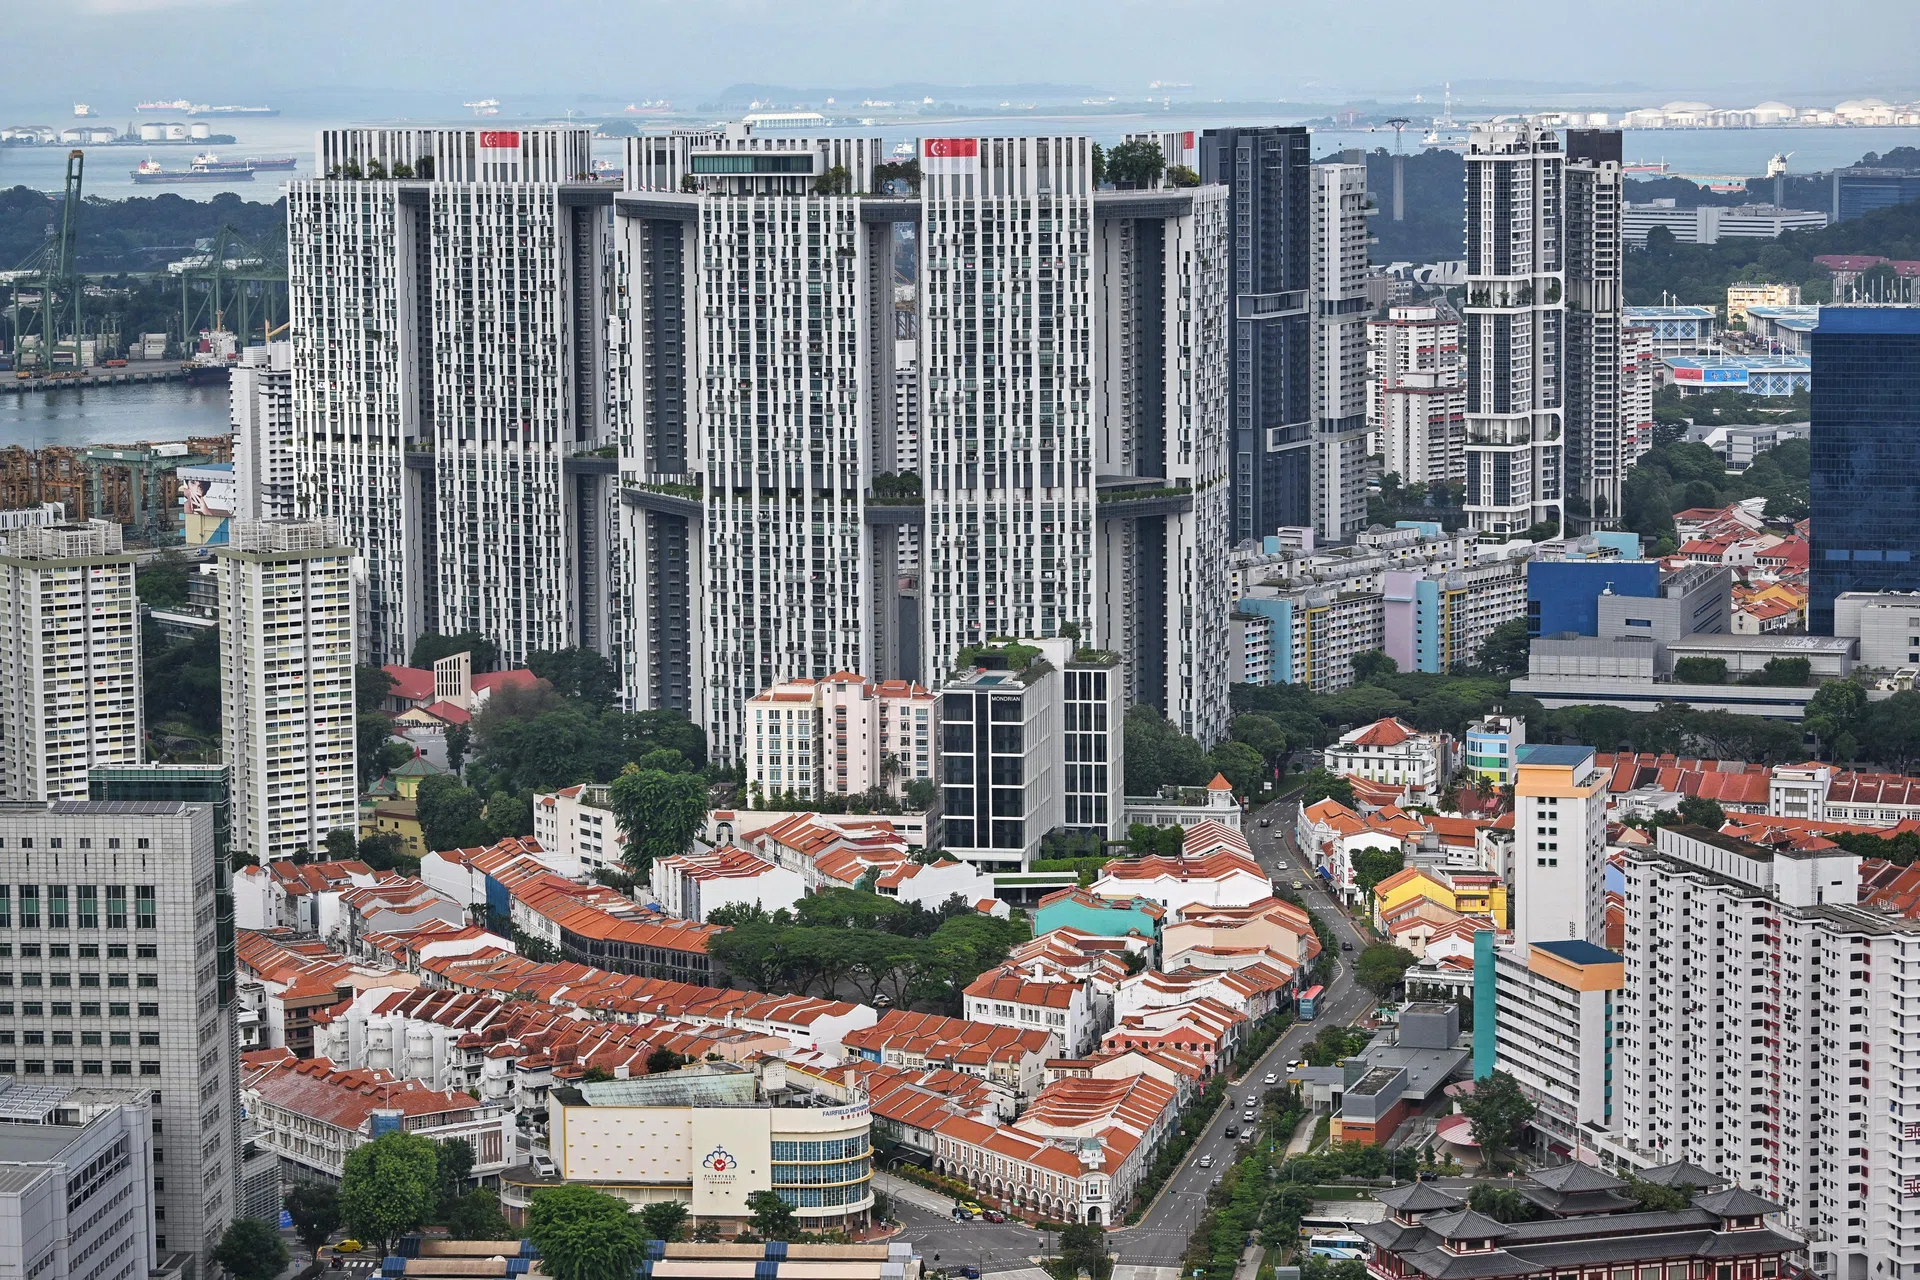
In the same quarter that Singapore minted a record 412 HDB resale flats sold for at least $1 million, the HDB Resale Price Index quietly did something it hadn't done in years: it fell. Not by much — somewhere in the region of 0.1% to 0.6%, depending on which preliminary read you trust — but it fell. And it was the first quarterly decline since 2019, snapping a remarkable run of consecutive increases that had become so reliable that many young buyers had simply stopped expecting prices to ever pause.
So which is it? Is the HDB resale market white-hot, churning out million-dollar flats at a record clip? Or is it cooling, with the index finally rolling over after years of relentless climbing? If you've been refreshing property news between Carousell flat listings and your bank's mortgage calculator, you've probably felt the whiplash. The headlines seem to contradict each other on the same page.
The short answer: both stories are true at once, and they're describing different parts of the same market. The million-dollar record is a tail event — the loud, photogenic top end of the distribution. The index dip is the broad middle — the quiet, unglamorous bulk of transactions where most Singaporeans actually buy and sell. This article unpacks the paradox, explains why a flood of roughly 13,500 newly eligible flats is the real force behind the softening, and gives you a grounded read on what it means if you're buying, selling, or just trying to make sense of your own flat's paper value.
The Paradox in One Picture
Let's start by being precise about the two numbers that seem to be at war.
- The record: A reported 412 HDB resale flats changed hands at $1 million or more in the quarter — the highest count ever recorded. The standout headline transaction was a unit at City Vue @ Henderson that reportedly sold for $1.728 million, setting a new benchmark for the most expensive HDB flat resale.
- The dip: The HDB Resale Price Index — the official barometer of broad resale prices — registered its first quarterly fall since 2019, a modest decline in the range of 0.1% to 0.6%.
Here is the crucial thing to understand: these two figures are not measuring the same thing.
The million-dollar count is an absolute tally of the top slice of the market — large flats, in prime or mature locations, often with rare attributes (high floors, unblocked views, central addresses, generous floor areas). The index, by contrast, is a price-weighted average movement across the entire resale market, the overwhelming majority of which is made up of ordinary 3-, 4-, and 5-room flats in heartland towns selling at heartland prices.
When you separate the two, the contradiction dissolves. A record number of trophy flats can sell at eye-watering prices even as the typical flat in the typical town softens — because the trophy flats and the typical flats are responding to different forces. The trophy market is driven by scarcity and the buying power of cash-rich upgraders and downsizers. The broad market is driven by supply and affordability. And right now, those two forces are pointing in opposite directions.
Why the Million-Dollar Headlines Keep Coming
Before we explain the dip, it's worth understanding why the million-dollar story refuses to die — because it's the part most people fixate on, and it's the part most likely to mislead you about the market as a whole.
A record count is not a record share
Singapore has a vast public housing stock — well over a million flats. When you hear "412 flats sold for over $1 million," the instinct is to imagine the entire heartland going six figures. But 412 transactions is a tiny fraction of total quarterly resale volume, which typically runs into the several thousand. The million-dollar segment, even at a record, remains a low single-digit percentage of all resale deals.
What's growing is the count, and there are structural reasons for that:
- Price drift over a decade. After years of cumulative appreciation — the resale index has climbed roughly 55% since 2020 alone — the dollar threshold of "$1 million" simply catches more flats than it used to. A million dollars isn't the ceiling it was in 2015; it's increasingly the price of a large, well-located flat with good attributes.
- More premium stock reaching resale. Newer flats in attractive locations — including Prime and Plus-type developments and well-located Build-To-Order projects from the 2010s — are completing their Minimum Occupation Period and entering the resale market. Many of these are genuinely premium products.
- The upgrader–downsizer cash pool. Buyers at this end are frequently cash-rich — private property sellers moving back into public housing, or families pooling proceeds. They're far less sensitive to interest rates and loan limits than a first-timer, so they can bid up scarce, desirable units without flinching.
The City Vue @ Henderson record, in context
The $1.728 million sale at City Vue @ Henderson is a textbook trophy transaction: a central location bordering the city fringe, a newer development, a high floor, and the kind of attributes that almost never come to market together. It is real, and it is a genuine record. But it tells you about as much about the average HDB flat as a record penthouse sale tells you about the average condo. It's the extreme of the distribution, not its centre.
Key takeaway: A record number of million-dollar flats reflects the strength of the top tail and a decade of price drift — not the temperature of the broad market. Treat these headlines as a story about scarcity, not a signal about your own flat's resale prospects.
The Real Story: ~13,500 MOP Flats Flooding the Market
If the million-dollar flats are the loud distraction, the quiet driver of the index dip is supply. Specifically, a large wave of flats reaching the end of their Minimum Occupation Period (MOP) — the five-year window after which BTO owners can finally sell on the open market.
This year's MOP cohort is reportedly around 13,500 flats. That's a substantial injection of resale supply hitting the market in a relatively concentrated window, and basic economics does the rest: more sellers competing for the same pool of buyers softens prices.
Why MOP supply matters more than usual right now
A few factors amplify the effect of this particular wave:
- It's concentrated. MOP flats don't trickle out evenly; they arrive in cohorts tied to when large BTO projects were launched. A big launch year five years ago produces a big resale wave now.
- It coincides with cooling demand levers. Government policy has been steadily nudging some demand out of the resale market — tightened loan-to-value limits on HDB loans, and a stronger pipeline of new BTO and Sale of Balance flats giving first-timers an alternative to paying resale premiums.
- Buyers finally have leverage. After years of being told to "buy now before it goes up again," buyers in well-supplied towns can suddenly negotiate. When five similar flats in the same estate are listed at once, the cash-over-valuation game weakens fast.
The result is a market that is bifurcating: scarce, premium flats keep setting records at the top, while abundant, ordinary flats in high-MOP-supply towns see prices flatten or dip. The index — being an average — leans toward the broad middle, which is why it ticked down even as the headlines screamed "record."
Putting Numbers to the Trend
It helps to zoom out and see how unusual a decline actually is in the recent history of this index. The HDB resale market has been on an almost uninterrupted climb since the pandemic-era surge.
HDB Resale Price Index — Annual Growth Trend (%)
The pattern above shows why a quarterly dip feels so jarring. Coming off a stretch where double-digit annual growth was normal — and where cumulative appreciation since 2020 sits around 55% — even a fractional decline reads as a regime change. But it's worth keeping the magnitude honest: a fall of 0.1% to 0.6% in a single quarter is a deceleration and pause, not a crash. It is the market catching its breath after a long sprint, not collapsing.
The two markets, side by side
| Dimension | The Million-Dollar Tail | The Broad Index |
|---|---|---|
| What it measures | Count of flats sold ≥ $1M | Average price movement, whole market |
| Latest signal | Record 412 transactions | First dip since 2019 (~0.1–0.6%) |
| Main driver | Scarcity + cash-rich buyers | ~13,500 MOP flats flooding supply |
| Typical buyer | Upgraders, downsizers, cash buyers | First-timers, families, rate-sensitive |
| Location skew | Central, mature, prime/plus estates | Heartland, high-MOP-supply towns |
| Headline volume | Very loud | Very quiet |
The table makes the core insight concrete: when someone tells you "the HDB market," ask which market they mean. The answer changes the entire story.
What the Analysts Actually Expect
Here's the part that should calm anyone who saw "first decline since 2019" and started panic-listing their flat: the property analyst consensus is not forecasting a downturn. Reported expectations cluster around 2% to 4% price growth for the full year — positive, but a clear step down from the heady gains of recent years.
In other words, the professional read is moderation, not reversal. The single-quarter dip is best understood as the market normalising toward a slower, more sustainable pace, with the MOP supply wave temporarily tipping one quarter into negative territory.
HDB Resale: Recent Reality vs Forecast
This forecast band tells you two useful things:
- The long-term direction is still up. A market expected to grow 2–4% is not a market in distress. It's a market returning to something closer to its historical norm after an exceptional run.
- The easy gains are over. If you bought between 2020 and 2022 and watched your flat's paper value balloon, you should not extrapolate that experience forward. The next few years are likely to reward location, attributes, and timing far more than they reward simply owning anything.
A Grounded Read for Buyers and Sellers
So what do you actually do with this? Whether you're buying your first flat, upgrading, or sitting on one you might sell, the bifurcated market calls for a more deliberate approach than the "just buy, it always goes up" reflex of the last five years.
If you're buying
The MOP supply wave is, on balance, good news for you — in the right towns. More listings mean more choice and more negotiating room than buyers have had in years.
- Hunt where supply is heavy. Towns absorbing a big MOP cohort are where you'll find the softest pricing and the most willing sellers.
- Don't anchor on million-dollar headlines. Those records are about flats you're almost certainly not buying. The flat you want is priced by the broad market, which is flat-to-soft.
- Negotiate the cash-over-valuation premium. In well-supplied estates, COV is negotiable again. Use comparable recent transactions as your evidence.
If you're selling
The picture is more nuanced, and it depends entirely on what kind of flat you own.
- If you own a scarce, premium flat — large, high-floor, central, rare layout — the top end of the market is still strong, and trophy buyers are still paying up. Your flat is competing in the tail, not the middle.
- If you own an ordinary flat in a high-MOP town, you are now one seller among many. Price realistically against fresh comparables, not against last year's peak transactions. The buyer has options; your listing needs to earn the sale.
- Don't panic-sell over a 0.1–0.6% dip. A sub-1% quarterly move is noise relative to the 55% appreciation the market has banked since 2020. Selling into a temporary supply bulge purely out of fear is rarely the optimal move.
The mental model to carry forward
The single most useful habit in this market is to stop reading the HDB resale market as one thing. It is at least two markets — a scarcity-driven top tail and a supply-driven broad middle — and they can, and now do, move in opposite directions at the same time. The headline that makes you anxious and the headline that makes you greedy may both be true, and neither may describe your flat.
Food for Thought
- If "$1 million" increasingly just means "a nice flat in a good spot," is the million-dollar milestone still meaningful — or is it just a number that inflation and a decade of appreciation have rendered ordinary at the top end?
- The ~13,500 MOP flats are softening prices today. But that wave will pass, and demand from the next generation of first-timers keeps building. Is this dip the start of a trend, or a one-quarter blip in a structurally tight market?
- When buyers and sellers in the same town read the same "record million-dollar" headline, the buyer feels priced out and the seller feels emboldened — even though that headline describes neither of their flats. How much of property "sentiment" is just people misreading which market they're in?
- Policymakers have been pulling demand levers (LTV limits, BTO supply) to cool resale prices. Now MOP supply is doing the cooling for them. Does this hand the government room to ease off — or does the bifurcation between premium and ordinary flats become its own policy headache?
- If analysts are right that 2–4% is the "new normal," how should a young Singaporean weigh a flat as a home versus a flat as an appreciating asset — when the asset story is suddenly so much quieter than it was three years ago?
The Bottom Line
The paradox was never really a paradox. A record 412 million-dollar flats and a first-since-2019 index dip are two true statements about two different markets sharing one roof. The top tail is loud, scarce, and cash-driven. The broad middle is quiet, well-supplied, and — for the first time in years — softening under the weight of roughly 13,500 MOP flats finding their way to the open market. The professional consensus of 2–4% growth says the sky isn't falling; the market is simply downshifting from sprint to jog.