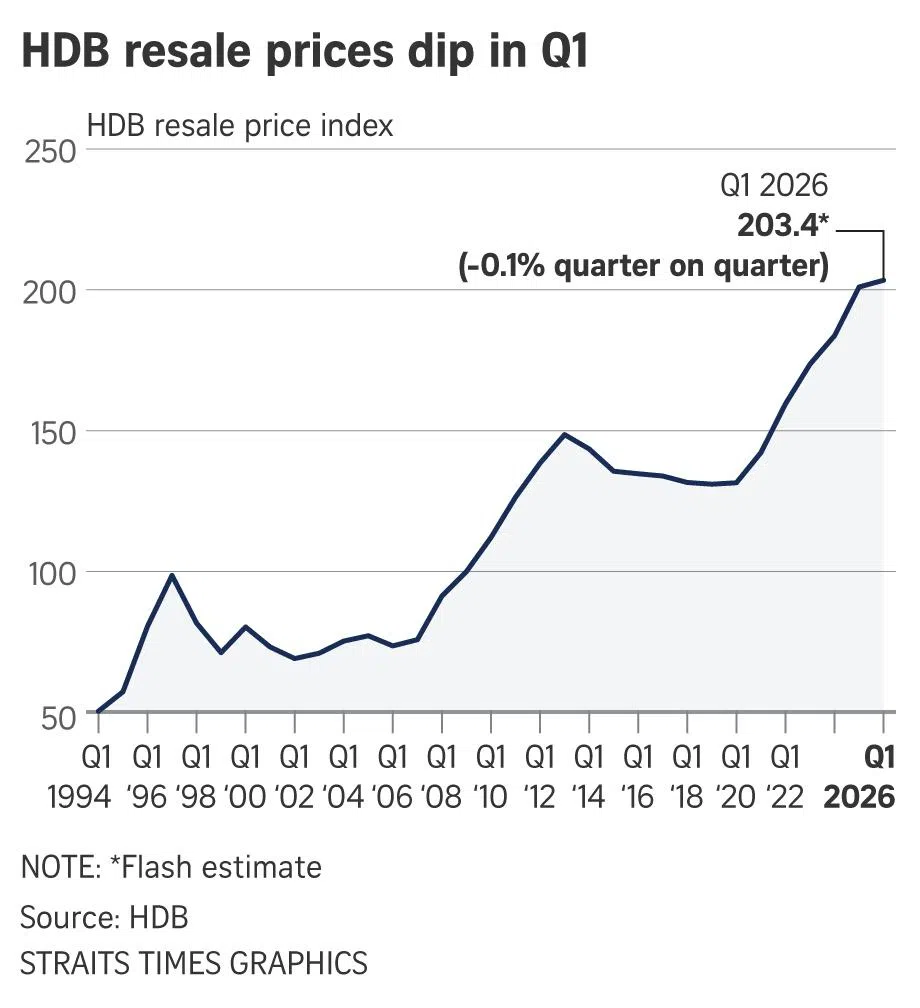
For nearly seven years, one number in the Singapore property market only ever went up. The HDB Resale Price Index — the official barometer of what your neighbour's flat is worth — climbed through a trade war, a pandemic, a construction crunch, and round after round of cooling measures. Then, on 31 March 2026, the flash estimate landed with a quiet thud: 203.4, down 0.1% from the previous quarter. It was the first quarterly decline since Q2 2019. After years of "prices only go up," the headline practically wrote itself — is the HDB resale boom finally over?
Here's the honest answer up front: not really, but also, kind of. A 0.1% dip is not a crash — it's a rounding error that happens to carry enormous symbolic weight. The index is still sitting just 0.3 points below its all-time high, and it's still up 1.2% year-on-year. Yet the direction of momentum has changed for the first time in a generation of buyers, and that shift is being driven by two very real forces: a once-in-years wave of newly-sellable flats, and cooling measures that are still quietly draining borrowing power out of the system.
If you're a Singaporean in your late twenties or thirties trying to figure out whether to buy, sell, or wait in 2026, this is the article that untangles what actually happened — and what it means for your timing.
The Headline Numbers, Decoded
Let's start with the raw scoreboard for Q1 2026, because the story lives in the details, not the headline.
| Metric | Q1 2026 | Change | What it means |
|---|---|---|---|
| Resale Price Index (RPI) | 203.4 | −0.1% q-o-q | First quarterly decline since Q2 2019 |
| RPI year-on-year | — | +1.2% y-o-y | Still positive — just far slower than before |
| Resale transactions | 6,285 | −4.6% y-o-y | Fewer deals than a year ago |
| Million-dollar flats | 412 | +23.4% y-o-y | A record 6.6% of all deals |
| Previous peak RPI | 203.7 (Q3 2025) | — | Q1 2026 sits a hair below the record |
The core narrative is this: the index hit a record 203.7 in Q3 2025, held dead flat through Q4 2025, and then ticked down to 203.4 in Q1 2026. That's the first negative print in almost seven years — but it's a 0.1% dip, not a drop. The market is plateauing at a record-high level, not correcting away from it.
It's worth pausing on one quirk in the volume number. Transactions came in at 6,285 — down 4.6% year-on-year, but up 19.6% quarter-on-quarter. Don't be fooled by that quarterly jump: Q1 almost always beats Q4 because of seasonal timing (year-end is sleepy for property). The honest comparison is the year-on-year figure, which is firmly negative. Fewer people are buying resale flats than a year ago, and that softening demand is exactly what's nudging the price index down.
So the picture is a market that is busy but cooling — still transacting at high prices, but with the heat visibly leaking out.
This Wasn't Sudden — The Cooling Was Years in the Making
The temptation is to read "first decline since 2019" as a dramatic turning point that came out of nowhere. It didn't. Q1 2026 is the logical next step in a glide path that had been bending downward for over a year.
Look at the trajectory of annual price growth, and the deceleration is impossible to miss:
HDB Resale Price Growth — From Red-Hot to Reverse
- 2024 full year: ~9.7% growth — genuinely red-hot, the kind of pace that made flats feel like they were appreciating faster than you could save.
- 2025 full year: ~2.9% growth — the slowest annual pace since 2019.
- Q4 2025: 0.0% — the first flat quarter since Q1 2020.
- Q1 2026: −0.1% — the first outright decline since Q2 2019.
Read sequentially, Q1 2026 is the natural endpoint of five consecutive quarters of stalling or near-zero growth. This is why several analysts are calling it a "meaningful inflexion point" rather than a one-off wobble — the trend has been clear for a while. But the magnitude matters just as much as the direction. One-tenth of one percent tells buyers and sellers that the tide is easing, not crashing.
There's also a crucial historical anchor here. The last time the RPI fell — in Q2 2019 — it kicked off a soft patch. But that was before the pandemic-era surge that drove the index up roughly 50% between 2020 and 2024. Today's flat reading is happening from a structurally much higher base. A 0.1% dip off a record high is a very different animal from the start of a multi-year slide.
To understand why the cooling arrived now, you need to understand the two forces converging on the market in 2026. Think of it as a supply shock meeting a demand drag.
Let's take each driver in turn.
Driver #1 — The 2026 MOP Supply Wave
The single biggest structural force behind the softening is a flood of flats becoming sellable all at once.
Here's the mechanism. When you buy a new BTO flat, you're legally required to live in it for a Minimum Occupation Period (MOP) — typically five years — before you can sell it on the resale market. That means the resale supply in any given year is essentially set in stone five years earlier, by how many flats were keyed in back then. And 2026 happens to be the year a huge cohort crosses that five-year line.
- Roughly 13,480 flats reach their MOP in 2026 — about double the ~6,970–8,000 that cleared MOP in 2025.
- Once a flat clears MOP, the owner can finally list it — adding inventory to the exact market where families are shopping.
- A large share of this wave are 4-room and 5-room flats — the most family-demanded layouts.
And critically, this supply isn't spread evenly across the island. It's heavily concentrated. Around 80% of the 2026 MOP wave lands in just five towns:
Where the 2026 MOP Supply Lands (Top 5 Towns)
| Town | MOP flats in 2026 | Share of total |
|---|---|---|
| Punggol (esp. Northshore) | 3,222 | 23.9% |
| Queenstown (Dawson — SkyResidence, SkyOasis) | 2,405 | 17.8% |
| Tampines | 2,133 | 15.8% |
| Toa Payoh | 1,594 | 11.8% |
| Bedok | 1,440 | 10.7% |
The plain-terms takeaway is simple supply and demand: more listings means less buyer desperation, which means more room to negotiate. Property agents are reporting that deals are taking longer to close as buyers, no longer fighting over scarce listings, gain leverage. This is the mechanism quietly cooling the broad, mass-market end of the index.
And the MOP wave isn't the only source of fresh supply. The BTO pipeline keeps feeding the market in parallel:
- The June 2026 BTO exercise alone offers ~6,900 flats across five towns.
- The full-year 2026 BTO/SBF pipeline is around ~19,600 units.
- Four straight years of steady BTO launches — many now with shorter 3-year (or less) waiting times — are siphoning away buyers who might otherwise have gone resale.
That last point matters more than it looks. Historically, one of the biggest reasons people paid a premium for resale was immediacy — you could move in now instead of waiting four-plus years for a BTO to be built. But as BTO waiting times shrink, that "I can't wait" premium erodes. Some would-be resale buyers are now content to ballot for a new flat instead, draining demand from the resale pool just as supply surges into it.
Driver #2 — The LTV Cut (And Why the Timing Is Misunderstood)
The second driver is a policy lever that's widely cited but frequently misdated — so let's get the facts straight, because the timing changes how you should read it.
The Loan-to-Value (LTV) limit on HDB loans was cut from 80% to 75%, but this happened on 20 August 2024 — not in 2026. The move brought HDB concessionary loans in line with the 75% ceiling that already applied to bank loans. In plain terms: where you could once borrow up to 80% of your flat's value, you can now borrow only 75%, meaning you need a larger cash or CPF down payment to close the same purchase.
To soften the blow for first-timers, the government simultaneously raised the Enhanced CPF Housing Grant (EHG):
- Up to $230,000 for eligible first-timer families
- Up to $115,000 for eligible singles
So why does this matter for Q1 2026 if it was implemented in August 2024? Because cooling measures don't act like a light switch — they act like a slow drip. The LTV cut is best understood as a cumulative, lagged drag on affordability and borrowing power that's been compounding for well over a year. It didn't cause an instant price drop in 2024; it gradually trimmed how much buyers could stretch, and that effect is still working its way through the system in 2026 — now compounding with the supply wave.
This is precisely how 99.co's chief data officer framed the dip: "past cooling measures and the ramp-up in BTO supply are starting to work through the market." The 2024 measures and the 2026 supply wave aren't competing explanations — they're two pressures arriving at the same moment.
Here's how the affordability math actually shifted under the new LTV regime, using a simple illustrative example:
| Scenario | $600,000 flat, old 80% LTV | $600,000 flat, new 75% LTV |
|---|---|---|
| Maximum HDB loan | $480,000 | $450,000 |
| Minimum down payment | $120,000 | $150,000 |
| Extra cash/CPF needed | — | +$30,000 |
(Figures are illustrative to show the mechanism, not a quote for any specific flat.)
That extra $30,000 of upfront capital is real money that has to come from somewhere — and for many young buyers, it's the difference between buying now and saving for another year. Multiply that hesitation across thousands of households and you get exactly the kind of demand softening that flattens a price index.
The takeaway: when you read commentary blaming "cooling measures" for the Q1 2026 dip, understand that it's not a fresh 2026 shock. It's the standing backdrop — the lower LTV, the 15-month wait-out for private downgraders, and tighter resale scrutiny — all of which predate this quarter and are simply continuing to bite.
The Bifurcation — Why the Top End Is Still Booming
Now for the most fascinating feature of Q1 2026, and the one that most complicates the "is the tide turning?" question: the market split into two speeds at once.
While the broad index dipped, the luxury end of the HDB market didn't just hold — it set records. Look at how price changes diverged by flat type:
Q1 2026 Price Change by Flat Type (% q-o-q)
- Falling: 1-room (−4.4%), Executive (−2.9%), 5-room (−0.7%)
- Rising: 2-room (+1.5%), 3-room (+1.0%), 4-room (+0.8%)
But the headline-grabber is the million-dollar flat segment, which utterly defied the dip:
- 412 flats sold for $1 million or more — up 17.7% q-o-q and 23.4% y-o-y.
- That's now 6.6% of all resale deals — up from just 1.2% four years ago.
- The quarter's record sale: a 5-room Queenstown flat at roughly $1.7 million.
- 4-room flats led the million-dollar deals (190), followed by 5-room (143).
- Hotspots clustered in the mature, central towns: Toa Payoh (72), Bukit Merah (57), Queenstown (55), Ang Mo Kio (41), Kallang/Whampoa (32).
To see just how dramatically the million-dollar segment has gone from rarity to routine:
Million-Dollar Flats as % of All Resale Deals
And the price spread for the very same flat type, depending on where it sits, is staggering:
| Flat type | Most expensive town | Cheapest town | Ratio |
|---|---|---|---|
| 4-room | Queenstown ~$1,040,000 | Jurong West ~$535,500 | ~2× |
| 5-room | Toa Payoh ~$1,100,000 | Jurong West ~$635,000 | ~1.7× |
How do we square a falling index with record luxury sales? The two-speed dynamic explains it. The MOP supply wave is concentrated in places like Punggol and the outlying mass market, where the flood of fresh listings eases competition and softens prices — and that's the part of the market that dominates the overall index. Meanwhile, central, mature, large flats remain genuinely scarce. Buyers who can afford them increasingly see a $1.7M HDB flat in Queenstown as value compared to a $2M-plus condo in the same location. So the bottom and middle cool while the top gets bid up.
As Nicholas Mak of Mogul put it, large, centrally located ~$1M flats "continue to attract buyers who see [their] comparative value" against $2M+ condos. The dip is real — but it's a story of where and what, not a uniform decline.
What the Experts Are Saying
It's worth gathering the analyst commentary in one place, because there's a striking consensus on what's happening — and on what isn't.
- Christine Sun (Realion Group) attributes the dip to "slower buying sentiment, as more resale flats reached their MOP and were listed," and notes that "deals are taking longer to close as buyers gain more leverage."
- Eugene Lim (ERA Singapore) emphasises that "the resale market continues to act as a crucial outlet for unmet housing demand, especially for buyers who value immediacy" — a reminder that resale demand is structural, not fragile.
- Nicholas Mak (Mogul) points to the resilience of the central, large-flat segment against the comparative cost of private condos.
- 99.co's Chief Data & Analytics Officer offers the cleanest summary: the dip "suggests that past cooling measures and the ramp-up in BTO supply are starting to work through the market."
And on the forecasts? The full-year 2026 projections cluster tightly:
| Outlook | Full-year 2026 forecast |
|---|---|
| Consensus range | +2% to +4% |
| ERA (most optimistic) | +2% to +5% |
| General lean | Toward the lower end |
The dominant read across the industry is moderation, not correction. Notably, every major forecast for 2026 is still positive — no serious analyst is calling for a sustained price decline. They're calling for slower growth, which is a very different thing.
Is This a Blip or a Turn? — Reading the Tea Leaves
This is the question everyone actually wants answered, so let's lay out both cases honestly.
The case that it's a genuine TURN (structural softening):
- Five straight quarters of stalling or declining growth — that's a trend, not noise.
- A real supply shock — MOP listings roughly doubling, plus a heavy BTO pipeline.
- Cooling measures (LTV cut, grants, wait-out rules) are still compounding through the system.
- Buyers now hold genuine negotiating leverage, and deals are slowing.
The case that it's a BLIP / soft plateau (not a crash):
- The fall is 0.1% — the index remains within 0.3 points of its all-time high.
- Year-on-year growth is still positive (+1.2%).
- The mature-estate and luxury segment is rising, not falling.
- The rental market is essentially stable (~−0.1%) — no distress signal there.
- Every analyst forecast for 2026 is positive (+2–5%).
So which is it? The honest synthesis is that both are partly true, and the framing that fits the data best is this: a managed plateau at record highs. The market is shifting from "sellers' frenzy" to "balance" — not tipping into a downturn.
The "tide turning" language is justified in one specific, important sense: the direction of momentum has changed. For the first time since 2019, a seller can no longer simply assume that waiting another quarter will fetch a higher price. That's a real psychological shift. But a 0.1% dip from a record high is a very long way from a price collapse. The tide is going out gently, not violently.
What It Means for Timing in 2026
Theory is nice, but you came here for a decision. Here's how the Q1 2026 picture translates into action depending on which side of the transaction you're on.
If you're a BUYER
This is the most buyer-friendly HDB resale market since 2020 — in the right segments.
- You have more leverage than at any point in years. The MOP wave means more listings — especially 4- and 5-room flats — in Punggol, Queenstown, Tampines, Toa Payoh, and Bedok. These five towns are where negotiation room will be widest.
- Time is on your side in mass-market and outlying estates. Competition is thinning, and supply peaks during 2026. If you're flexible on location, waiting through the year as inventory floods in is a defensible strategy.
- But the central, mature ≥$1M segment is still tight. If your heart is set on Queenstown, Toa Payoh, or Bukit Merah, don't expect bargains — scarcity still rules there, and the million-dollar market is still setting records.
- Budget for the 75% LTV. You'll need a bigger cash/CPF down payment than under the old 80% regime. First-timers should max out the EHG — up to $230,000 for families.
If you're a SELLER
The hard truth: the "name your price" era is over in the broad market.
- You're now competing with a wave of fresh MOP listings — especially acute if your flat sits in one of the five high-supply towns.
- Price realistically and list earlier rather than holding out for further appreciation. Momentum has flattened, and deals are taking longer to close.
- If you own a large, central, or high-floor flat, you're in the resilient segment. The million-dollar market is still breaking records, so a premium, well-located unit can still command a strong price.
- Mind the timing risk. The heaviest MOP supply hits during 2026. Listing before the peak of competing inventory floods your specific town could be a meaningful advantage.
Here's a simple decision frame for sellers weighing the timing:
If you're an UPGRADER (the real "investor" lens)
HDB resale is a regulated, owner-occupier market — there's no buy-to-let here, so the "investor" question is really an upgrader question. And the math has gotten harder:
- A softening resale market means your HDB flat may fetch slightly less or take longer to sell.
- The tighter 75% LTV makes the sell-HDB-buy-condo arithmetic more demanding on the cash side.
- Stable rents (~−0.1%) offer no tailwind to offset the squeeze.
None of this kills the upgrade path — but it does mean the window where everything moved in your favour has narrowed. Run the numbers carefully before committing.
A Quick-Reference Fact Sheet
For the skimmers, here's everything in one glance:
- RPI Q1 2026: 203.4, −0.1% q-o-q, +1.2% y-o-y — first decline since Q2 2019.
- Annual growth trajectory: 2024 ~9.7% → 2025 ~2.9% → Q4 2025 flat → Q1 2026 −0.1%.
- Volume: 6,285 transactions, −4.6% y-o-y (the +19.6% q-o-q is just seasonal).
- MOP wave: ~13,480 flats in 2026 (≈double 2025's ~6,970–8,000); ~80% in Punggol, Queenstown, Tampines, Toa Payoh, Bedok.
- LTV: cut 80%→75% on 20 Aug 2024 (a lagged drag, not a 2026 measure); EHG raised to up to $230k (families) / $115k (singles).
- Million-dollar flats: 412 (record), 6.6% of all deals; record $1.7M 5-room Queenstown.
- BTO: June 2026 exercise ~6,900 flats; 2026 pipeline ~19,600 units.
- 2026 forecasts: +2% to +5% — moderation, not correction.
Food for Thought
The numbers tell us what happened. The harder questions are about what comes next — and what it means for how we think about public housing as both a home and an asset.
-
If the only thing keeping the index positive is a booming million-dollar segment, what happens to the "affordability" promise of HDB? When a 5-room flat in Queenstown sells for $1.7M while the broad market cools, is the HDB resale market quietly splitting into two housing systems?
-
The MOP wave is predictable — it's set five years in advance by BTO completions. If supply gluts and shortages can be forecast this clearly, should buyers and sellers be timing their moves around the MOP calendar the way investors time earnings season?
-
Cooling measures from 2024 are still rippling through the market in 2026. If policy effects take this long to fully land, how should anyone interpret a single quarter's data without waiting another year to see the full picture?
-
Shorter BTO waiting times are eroding the "immediacy premium" that resale flats once commanded. As the wait for a new flat shrinks, does the entire logic of paying more for resale start to unravel — and what does that mean for resale values long-term?
-
A 0.1% dip generated national headlines. How much of the "is the tide turning?" anxiety is about the actual data, and how much is about a generation of buyers who have never seen HDB prices do anything but rise?
The Bottom Line
So, is the tide turning? The most accurate answer is that the momentum has turned, but the market has not collapsed. Q1 2026 marks a genuine inflexion point — the moment sellers lost their automatic upper hand — arriving exactly as a doubled MOP supply wave collides with cooling measures that have been compounding since 2024. But it's a managed plateau at record highs, not the start of a slide. For buyers, it's the best leverage in years in the right towns; for sellers, it's the end of naming your price; for everyone, it's a market finding balance after half a decade of frenzy.