After three consecutive quarters of decline, Singapore's private residential property market has decisively turned a corner. The Urban Redevelopment Authority's (URA) flash estimate for Q1 2024 revealed a 1.6% quarter-on-quarter price increase—a signal that has caught the attention of prospective buyers, upgraders, and investors alike. But this isn't just another headline about rising prices. Beneath the surface lies a fascinating divergence: while the Rest of Central Region (RCR) surged ahead with a remarkable 3.8% gain, the Core Central Region (CCR) noticeably lagged, painting a complex picture of where the real demand is shifting.
For young Singaporeans navigating their first property purchase or planning their upgrade from an HDB flat, understanding this market dynamic isn't just helpful—it's essential. The question isn't simply whether prices are going up or down. It's about which segments are leading the recovery, why certain districts are outperforming others, and what this means for your timing and strategy.
The Market Turnaround: From Decline to Recovery
To appreciate the significance of Q1 2024's rebound, we need to understand what preceded it. Singapore's private property market experienced a rare three-quarter decline stretching from Q2 2023 through Q4 2023. This downturn was attributed to a confluence of factors: aggressive cooling measures introduced in April 2023 (including the doubling of Additional Buyer's Stamp Duty for foreigners to 60%), rising interest rates, and a general wait-and-see sentiment among buyers.
The Q1 2024 flash estimate changed the narrative. Here's how the quarterly price movements looked:
| Quarter | Price Change (QoQ) | Market Sentiment |
|---|---|---|
| Q2 2023 | -0.2% | Beginning of decline |
| Q3 2023 | -0.7% | Continued softening |
| Q4 2023 | -1.6% | Sharpest quarterly drop |
| Q1 2024 | +1.6% | Decisive rebound |
Singapore Private Property Price Index Quarterly Change (%)
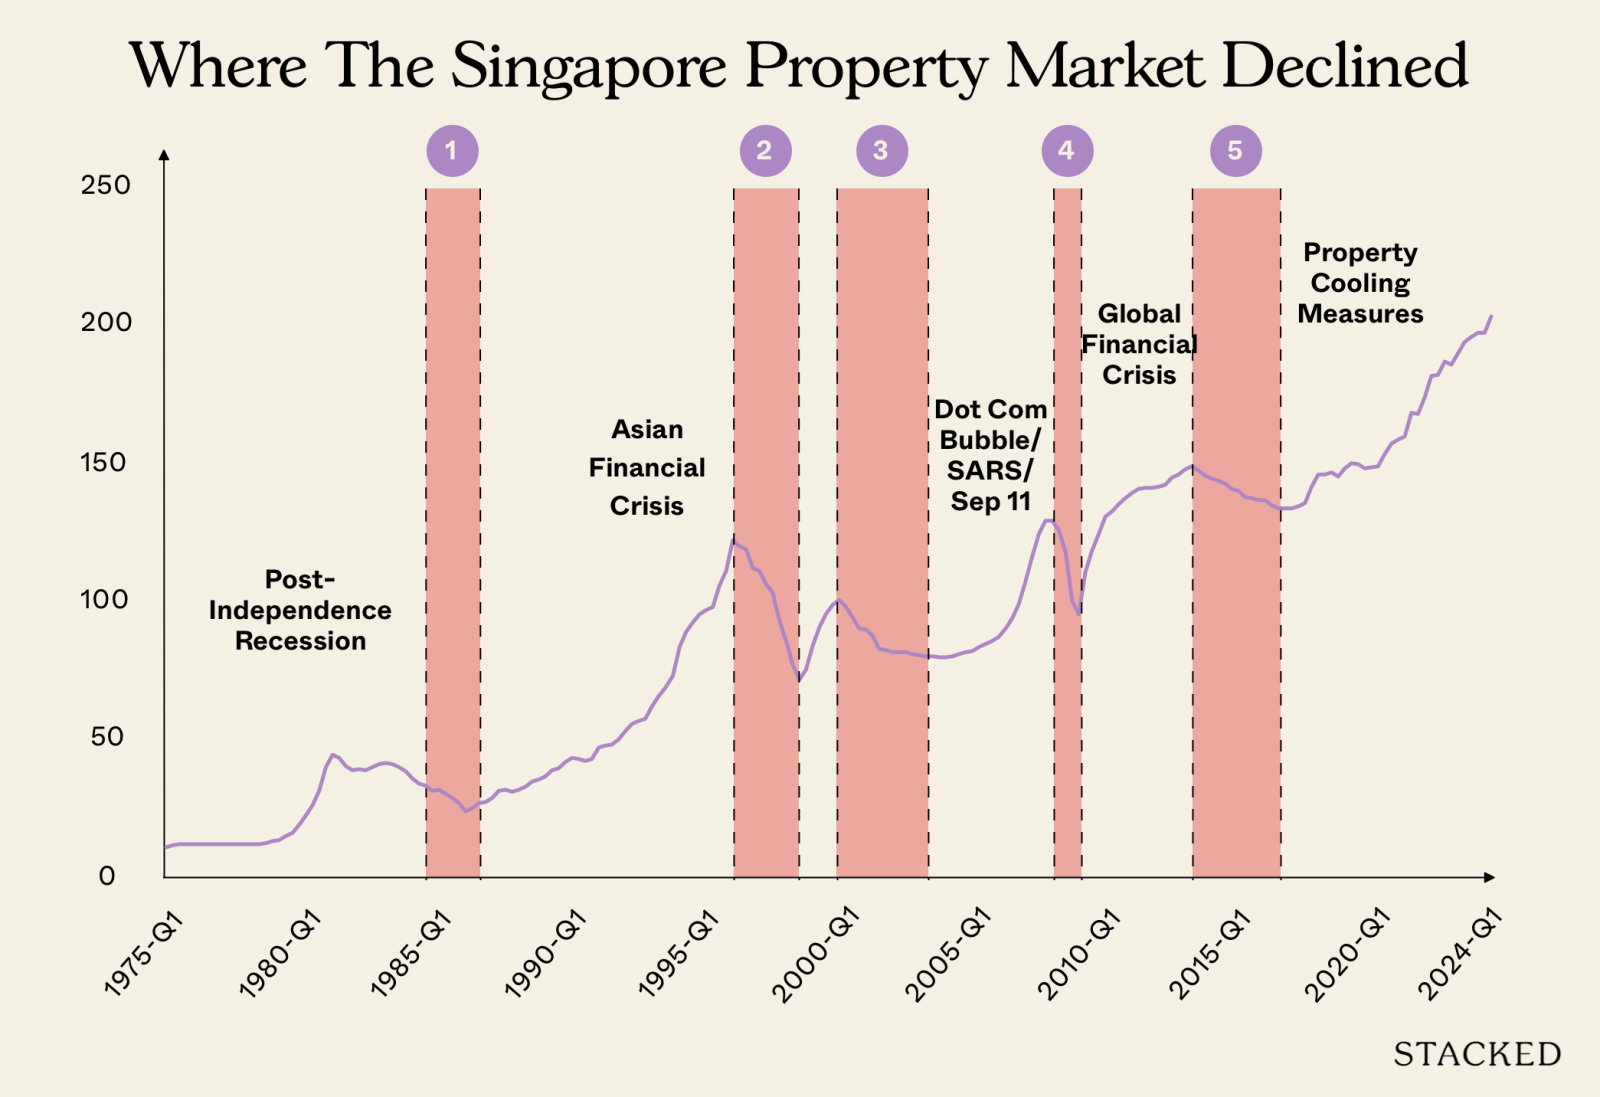
This V-shaped recovery pattern isn't unprecedented in Singapore's property history. Following the 2008 Global Financial Crisis, prices bottomed out in Q2 2009 before embarking on a sustained upward trajectory that lasted several years. Similarly, after the 2013 cooling measures triggered a four-year correction, the market found its footing in 2017 and gradually recovered. What makes Q1 2024 notable is the speed and decisiveness of the turnaround, suggesting underlying demand remained pent-up during the decline rather than evaporating.
The Great Divergence: RCR vs CCR vs OCR
The most striking aspect of Q1 2024's rebound isn't the overall 1.6% increase—it's how unevenly distributed that growth was across Singapore's three main market segments.
| Market Segment | Q1 2024 Price Change | Characteristics |
|---|---|---|
| Rest of Central Region (RCR) | +3.8% | City fringe, popular with upgraders |
| Outside Central Region (OCR) | +0.5% | Mass market, suburban locations |
| Core Central Region (CCR) | -0.3% | Prime districts, luxury segment |
Q1 2024 Private Property Price Change by Market Segment (%)
Why Did RCR Lead the Charge?
The RCR's exceptional 3.8% quarterly surge—more than double the overall market increase—reflects several converging factors:
1. The Sweet Spot for HDB Upgraders The RCR occupies a strategic middle ground. It's close enough to the city center for convenient commuting, yet far enough to offer more space and relatively affordable entry prices compared to prime CCR districts. For HDB upgraders who have built substantial equity in their public housing flats, the RCR represents an achievable step up without stretching finances to breaking point.
2. New Launch Momentum Several well-received new launches in RCR locations like Bukit Merah, Queenstown, and the eastern fringe (Marine Parade, Katong) contributed significantly to price appreciation. Projects such as The Continuum, Grand Dunman, and Tembusu Grand saw strong take-up rates, with many buyers being HDB upgraders leveraging their existing properties.
3. Relative Value Proposition After the CCR's prolonged outperformance in previous cycles, the RCR emerged as offering better value. With CCR prices having risen substantially and foreign demand dampened by the 60% ABSD rate, local buyers increasingly looked to the city fringe for opportunities.
Why Did CCR Lag?
The CCR's -0.3% decline in Q1 2024 tells its own story:
- Foreign buyer exodus: The 60% ABSD for foreigners effectively removed this traditionally significant buyer segment from the CCR market
- Investor caution: With rental yields compressing and capital appreciation uncertain, investors became more selective
- High base effect: CCR prices had already reached elevated levels, making further gains harder to justify
- Vacancy pressures: Higher vacancy rates in prime districts (10.3% in Q1 2025, compared to 6.6% in RCR and 4.7% in OCR) suggested oversupply concerns
OCR: The Steady Performer
The OCR's modest 0.5% increase reflects a market segment that never really declined as sharply as the CCR during the 2023 downturn. Mass-market properties in suburban locations maintained relatively stable demand from genuine owner-occupiers and first-time buyers. However, the OCR didn't surge like the RCR because:
- Affordability ceiling: Many OCR properties were already approaching price levels that stretched first-time buyer budgets
- Limited new launch activity: Fewer major launches in Q1 2024 compared to the RCR
- HDB resale competition: Strong HDB resale prices provided an alternative for some buyers
Historical Context: Recovery Cycles and What They Teach Us
Singapore's property market has demonstrated remarkable resilience through multiple cycles. Understanding these historical patterns provides crucial context for interpreting Q1 2024's rebound.
The 2008-2013 Boom Cycle
Following the Global Financial Crisis, Singapore's property market experienced one of its most dramatic recoveries:
- Q2 2009: Market bottomed with prices down ~25% from peak
- 2009-2013: Sustained upward trajectory with multiple years of double-digit growth
- Peak: 2013, before the eighth round of cooling measures finally halted the rally
This cycle was characterized by broad-based participation across all segments, fueled by low interest rates, strong economic recovery, and significant foreign investment.
The 2013-2017 Correction
The introduction of Total Debt Servicing Ratio (TDSR) requirements in 2013 triggered a prolonged correction:
- Duration: 15 consecutive quarters of decline or stagnation
- Total decline: Approximately 11% from peak to trough
- Recovery pattern: Gradual, with prices flat-lining for extended periods before modest gains
This period taught us that policy interventions can fundamentally alter market dynamics and that recovery isn't always V-shaped.
The 2020-2023 Pandemic Surge
COVID-19 unexpectedly sparked a property boom:
- Q3 2020 to Q3 2023: Prices rose approximately 32% overall
- Key drivers: Low interest rates, work-from-home space needs, delays in construction creating supply shortages
- Segment divergence: RCR and OCR significantly outperformed CCR, with gains of 47% and 46% respectively versus CCR's 27%
Non-Landed Property Price Index Growth by Region (Q3 2020 = 100)
What Q1 2024 Suggests About This Cycle
The current recovery exhibits characteristics more similar to the 2020-2023 period than the 2008-2013 boom:
- Segment-specific growth: RCR and OCR leading, CCR lagging
- Local buyer dominance: Foreign participation minimal due to ABSD
- Upgrader-driven demand: HDB upgraders forming the backbone of transactions
- Policy-constrained: Cooling measures preventing speculative excess
This suggests a more sustainable, fundamentally-driven recovery rather than a speculative bubble.
The HDB Upgrader Effect: Understanding the Demand Engine
The sustained outperformance of RCR and OCR isn't coincidental—it's directly tied to the behavior of HDB upgraders, who have become the dominant force in Singapore's private property market.
The Upgrader Journey
Why RCR Specifically Appeals to Upgraders
Consider the typical HDB upgrader profile: a couple in their mid-30s to early 40s, having owned their flat for 8-12 years, with combined monthly incomes of $12,000-$18,000. They've built substantial equity—their HDB flat might be worth $600,000-$900,000, with perhaps $200,000-$400,000 remaining on their loan.
For this demographic, the RCR offers:
| Factor | RCR Advantage |
|---|---|
| Location | 15-25 minutes to CBD via MRT |
| Space | 900-1,200 sqft for $1.5M-$2.5M |
| Amenities | Established neighborhoods with mature facilities |
| Schools | Access to popular primary schools |
| Future upside | Ongoing rejuvenation (Paya Lebar, Kallang, Bukit Merah) |
| Rental potential | Strong tenant demand from young professionals |
The Numbers Behind Upgrader Demand
According to URA transaction data, HDB upgraders accounted for approximately 40-45% of non-landed private residential purchases in 2024. This represents a significant shift from pre-pandemic levels of around 30-35%. Several factors explain this increase:
- HDB resale price appreciation: The HDB resale price index rose approximately 25% from 2020-2024, creating substantial equity for upgraders
- Income growth: Median household incomes have grown steadily, expanding purchasing power
- Delayed upgrades: Some upgraders who waited during the pandemic surge entered the market in 2024
- Lifestyle aspirations: Post-pandemic priorities favoring space and quality of life
District Analysis: Where Value Still Exists
For buyers seeking entry points in this recovering market, understanding district-level dynamics is crucial. Not all RCR and OCR districts offer equal value.
RCR Districts with Relative Value
| District | Area | Median PSF (Q1 2024) | Key Attractions | Value Proposition |
|---|---|---|---|---|
| 3 | Tiong Bahru/Redhill | $2,400-$2,800 | Heritage charm, MRT connectivity | Gentrification ongoing, relatively affordable entry |
| 12 | Balestier/Toa Payoh | $1,900-$2,300 | Central location, food options | Older stock, renovation potential |
| 14 | Eunos/Paya Lebar | $2,100-$2,500 | Paya Lebar Quarter transformation | Major commercial hub developing |
| 19 | Serangoon/Hougang | $1,800-$2,200 | Good schools, MRT connectivity | OCR pricing with RCR accessibility |
| 23 | Bukit Panjang/Choa Chu Kang | $1,500-$1,900 | New MRT lines, greenery | Most affordable RCR entry point |
OCR Districts Worth Watching
| District | Area | Median PSF (Q1 2024) | Key Considerations |
|---|---|---|---|
| 18 | Tampines/Pasir Ris | $1,400-$1,700 | Regional center, excellent amenities |
| 22 | Jurong | $1,600-$2,000 | Jurong Lake District transformation |
| 25 | Woodlands | $1,200-$1,500 | RTS Link to Johor, affordability |
| 27 | Sembawang/Yishun | $1,100-$1,400 | North-South Corridor, value pricing |
| 28 | Seletar | $1,300-$1,600 | Aerospace hub, upcoming developments |
CCR Districts: Selective Opportunities
While the CCR overall lagged in Q1 2024, specific districts may offer value for buyers with sufficient budgets:
- District 9 (Orchard/River Valley): Premium locations with enduring appeal; look for older developments with en bloc potential
- District 10 (Tanglin/Holland): Family-friendly, proximity to international schools
- District 11 (Novena/Newton): Medical hub proximity, potential medical tourism rental demand
Timing Your Entry: Strategic Considerations
The Q1 2024 rebound raises the critical question: Is now the right time to buy, or should you wait?
Arguments for Entering Now
- Early recovery phase: Historical patterns suggest the strongest price gains often occur in the first 12-18 months of a recovery
- Interest rate outlook: With the Fed signaling potential rate cuts, mortgage costs may improve
- Limited supply pipeline: New launch supply in 2024-2025 is relatively constrained compared to historical averages
- Competition still manageable: Unlike peak periods, buyers aren't facing frenzied bidding wars
Arguments for Waiting
- Policy risk: Additional cooling measures remain possible if prices accelerate
- Economic uncertainty: Global recession risks could dampen sentiment
- CCR weakness may spread: If prime properties continue struggling, broader market sentiment could be affected
- Upcoming supply: Several major launches in late 2024 and 2025 may provide more choices
A Framework for Decision-Making
Policy Landscape: ABSD and Beyond
No analysis of Singapore's property market is complete without considering policy. The Additional Buyer's Stamp Duty (ABSD) framework, significantly tightened in April 2023, continues to shape market dynamics.
Current ABSD Rates (as of Q1 2024)
| Buyer Category | ABSD Rate |
|---|---|
| Singapore Citizens (1st property) | 0% |
| Singapore Citizens (2nd property) | 20% |
| Singapore Citizens (3rd property+) | 30% |
| Permanent Residents (1st property) | 5% |
| Permanent Residents (2nd property+) | 30% |
| Foreigners | 60% |
| Entities/Trusts | 65% |
These rates represent a dramatic increase from pre-2023 levels and have fundamentally altered buyer composition:
- Foreign buyer share: Dropped from ~10-15% historically to under 3%
- Investment demand: Significantly curtailed by 20-30% rates for multiple properties
- Owner-occupier dominance: Genuine demand now drives 90%+ of transactions
Policy Outlook
The government has consistently signaled its commitment to maintaining market stability. Key considerations:
- ABSD review calls: Industry groups have petitioned for ABSD adjustments, particularly for foreigners, but no changes have been announced
- Supply management: The Government Land Sales (GLS) program has been calibrated to ensure adequate supply without overshooting
- Cooling measure readiness: Officials have indicated willingness to introduce further measures if speculative activity emerges
Expert Perspectives: What Analysts Are Saying
Leading property consultancies offered varied interpretations of Q1 2024's rebound:
PropNex highlighted the RCR's outperformance as evidence of "enduring demand from HDB upgraders seeking quality homes in well-connected locations," projecting full-year 2024 price growth of 3-5%.
Knight Frank noted that "the market has found its footing after a challenging 2023," but cautioned that "sustained recovery depends on economic conditions and policy stability."
JLL emphasized the segment divergence, stating that "the performance gap between RCR and CCR reflects a fundamental repricing of risk and value in a higher interest rate environment."
Huttons Asia pointed to new launch activity as a key driver, observing that "well-located projects with competitive pricing continue to attract strong buyer interest, suggesting selective demand remains robust."
Food for Thought
As you contemplate your next property move in this rebounding market, consider these questions:
-
Segment Selection: Given the sustained outperformance of RCR and OCR versus CCR, are you allocating your property search to the right market segment for your budget and goals? Or are you still anchored to outdated notions of "prime" districts?
-
Upgrade Timing: If you're an HDB owner considering upgrading, how do you balance the benefit of rising HDB resale prices (increasing your equity) against the risk of rising private property prices (increasing your purchase cost)? Is there an optimal window?
-
Policy Resilience: With ABSD rates at historic highs and policy changes always possible, how much of your property decision assumes current conditions will persist? What would your strategy be if ABSD were adjusted—either tightened further or relaxed?
-
Long-term vs Short-term: The Q1 2024 rebound suggests recovery is underway, but historical cycles show recoveries can last years or falter quickly. Are you making your property decision based on where you'll be in 10 years, or trying to time the next 12 months?
-
Alternative Paths: If private property prices in your preferred areas remain out of reach even with the recovery, have you thoroughly explored alternatives—executive condominiums, resale HDB in prime locations, or even renting and investing the difference?
Conclusion
Singapore's private property market has undeniably turned a corner with Q1 2024's 1.6% rebound, but this recovery is anything but uniform. The RCR's exceptional 3.8% surge—driven by HDB upgraders seeking the sweet spot between accessibility and affordability—contrasts sharply with the CCR's continued struggle. For prospective buyers, this divergence presents both opportunities and challenges: the RCR's momentum suggests strong underlying demand, but also means competition and prices are rising fastest precisely where many upgraders want to buy.
The historical context of previous recovery cycles suggests that early phases often offer the best entry points, yet policy risks and economic uncertainties remain. The key is matching your personal circumstances—budget, timeline, and lifestyle needs—to the specific districts and segments where value still exists.